|
AIACC-DMS Methods
|
|
This portion of the website summarizes the
AIACC projects' methods for impacts, adaptation, and vulnerability
assessment, includes definitions of
the concepts used, and provides examples from
the AIACC projects. This page also synthesizes the climate
scenarios data and methodologies for developing regional
climate scenarios by each AIACC project. The purpose is
to build a framework for the synthesis of the results of
the AIACC program in order to provide summaries for policy-makers.
This section will be updated to include descriptions of
the different methodologies and to provide examples from
all the AIACC projects. Last update 20 June 2003.
|
| SUMMARY |
|
The following table provides a summary of the methods for
impacts, adaptation, and vulnerability assessment used
by each project.
| N |
Project |
Methods for VA |
| 1 |
AF04 |
Decision Support Systems |
| 2 |
AF07 |
n.a. |
| 3 |
AF14 |
Sustainable Livelihoods, Indicators |
| 4 |
AF20 |
n.a. |
| 5 |
AF23 |
Decision Support Systems |
| 6 |
AF38 |
Decision Support Systems |
| 7 |
AF42 |
Sustainable Livelihoods |
| 8 |
AF47 |
Cost-Benefit Analysis |
| 9 |
AF90 |
Indicators |
| 10 |
AF91 |
Indicators, Multi-criteria Analysis |
| 11 |
AF92 |
Indicators |
| 12 |
AS06 |
Decision Support Systems, Disaster Analysis |
| 13 |
AS07 |
Decision Support Systems, Disaster Analysis |
| 14 |
AS12 |
Decision Support Systems |
| 15 |
AS21 |
Indicators |
| 16 |
AS25 |
Multi-criteria Analysis |
| 17 |
LA06 |
Disaster Analysis |
| 18 |
LA26 |
Indicators, Decision Support Systems |
| 19 |
LA27 |
Decision Support Systems |
| 20 |
LA29 |
Indicators |
| 21 |
LA32 |
Indicators |
| 22 |
SIS06 |
Multi-criteria Analysis |
| 23 |
SIS09 |
Sustainable Livelihoods, Decision Support Systems |
| 24 |
SIS90 |
Decision Support Systems |
|
| DEFINITIONS
|
|
Exposure is the nature and degree to which a system
is exposed to significant climatic variations.
Exposure Unit is an activity, group, region, or
resource that is subjected to climatic stimuli.
Impacts (to climate) are the consequences of climate
change on natural and human systems.
Potential Impacts are all impacts that may occur
given a projected change in climate, without considering
adaptation.
Residual Impacts are the impacts of climate change
that would occur after adaptation.
Coping Range is the variation in climatic stimuli
that a system can absorb without producing significant
impacts. The coping range can be regarded as the adaptive
capacity of a system to deal with current variability.
Sensitivity is the degree to which a system is
affected, either adversely or beneficially, by climate-related
stimuli (change or extremes).
Adaptation refers to all those responses to climate
change that may be used to reduce vulnerability or to actions
designed to take advantage of new opportunities that may
arise as a result of climate change.
Vulnerability
Vulnerability = Sensitivity - Autonomous Adaptive Capacity
- Planned Adaptation
Current vulnerability = Current impacts – Coping
range
Future vulnerability = Future impacts – Planned
Adaptation – Coping range
Adaptive capacity is the ability of a system to
adjust to climate change, including climate variability
and extremes, to moderate potential damages, to take advantage
of opportunities, or to cope with the consequences. Adaptive
capacity to climate change refers to both the ability inherent
in the coping range and the ability to move or expand the
coping range with new or modified adaptations. Initiatives
to enhance adaptive capacity would expand the coping range.
Adaptive capacity may be considered as the policy response
to an impact as a function of the socio-political characteristics
of a location (ability to cope), e.g. defined through wealth
(GDP), democracy, etc. An adaptive capacity index may be
based on variables that are scenario dependant and geographically-explicit.
|
| EXAMPLES FROM AIACC
PROJECTS |
| Method |
AIACC Project |
| Indicators |
AF14, AF90, AF91, AF92, AS21, LA26, LA29,
LA32 |
| Sustainable Livelihoods |
AF14,
AF42, SIS09 |
| Cost-Benefit Analysis |
AF47 |
| Decision Support Systems |
AF04, AF23, AF38, AS06, AS07, AS12, LA26, LA27,
SIS09, SIS90 |
| Multi-criteria Analysis |
AF91, AS25, SIS06 |
| Disaster Analysis |
AS06, AS07, LA06 |
|
|
| EXAMPLES > Indicators
|
|
| LA26: Indicators
Project: Impact of Global Change on the Coastal
Areas of the Rio De La Plata: Sea Level Rise and Meteorological
Effects.
Urban Vulnerability
to Climate Change
Vicente Barros and Claudia Natenzon
Large areas of Buenos Aires city suffer frequent floods.
Climate Change is increasing the frequency and the area
covered by floods caused by storm tides in the Rio de la
Plata and the risk of permanent flood in coastal areas
(Figure 1). IPCC scenarios of sea level rise and climate
are used to develop scenarios of the main forcings of the
Plata water level.
This is done using two hydrodynamic numerical models:
- A two dimensional and vertically integrated model
that permits simulating water level under different conditions.
- A three dimensional model to simulate the salinity
front within the Rio de la Plata.
Scenarios of water level provide the input to assess present
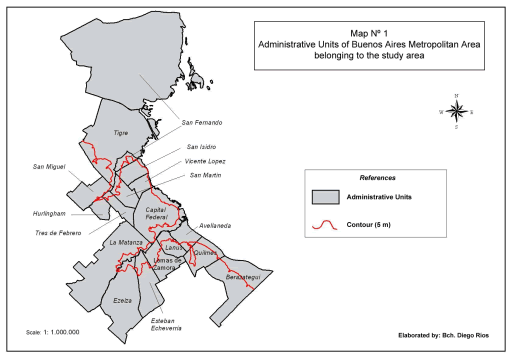
and future risks on the area potentially subject to permanent
or transient floods. The area affected by a 5 m sea level
rise is indicated in Figure 2. This cote results from the
projected maximum water level at Buenos Aires coast under
the combined forcing of the mean sea level rise of the
next hundred years, wind storms and the largest observed
stream flows of the two main tributaries of the La Plata
River.
Social vulnerability is studied from present social conditions
under “normal” and “stressed” situations.
Once the population that can be affected in a direct way
is estimated, the following steps are developed:
- Quantitative approach: Indicators (specific for each
case, that are also available and free of charge) about
demography, life conditions, work, production and consumption
- Quantitative approach: a Social Vulnerability Index,
as a preliminary identification of administrative units
with high Social Vulnerability.
- Qualitative approach: Land use; inventory of goods,
service and infrastructure in exposition.
- Qualitative approach: Dimensions of the Social Vulnerability
(economics, ideological cultural, policies/institutional)
in case studies.
Figure 1. Rio de la Plata and Buenos Aires
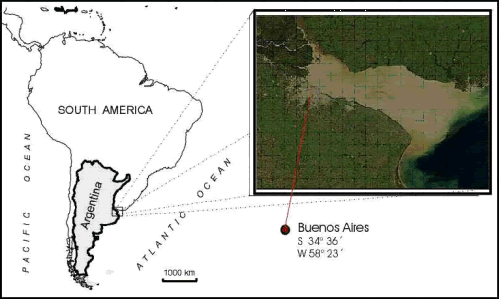
Figure 2. Area affected by a 5 m sea level rise.
LA29: Indicators
Project: Integrated Assessment of Social Vulnerability
and Adaptation to Climate Variability and Change Among
Farmers in Mexico and Argentina
Adaptive Capacity of Farmers to
Climate Variability and Change in Central Mexico
Carlos Gay and Marta Vinacour
In order to assess the adaptive capacity of farmers to
climatic variability and change, our project is basing
its methodology on the MESMIS [1] and
on recent research on social vulnerability in central Mexico [2].
The MESMIS framework was originally developed to evaluate
the sustainability of natural resource management in rural
areas. Analytically, we consider that adaptive capacity
is determined by the interaction of social, economic, institutional
and environmental processes that combine to affect farmers’ decisions
at the moment that they face climatic risk and change.
Adaptive capacity (AC) refers to farmers’ ability
to recognize present and future climatic risks, respond
to and cope with risk (through reorganization of activities,
investments, resource allocation, etc.) in order to minimize
risk of future negative consequences. Such capacity has
been defined as being related to specific sustainability
attributes of that system, and for our project we are using
the following [3]:
a) access to resources (AR) that are critical to preparing
for and recovering from climatic events, and are identified
together with stakeholder; b) flexibility (FL), which reflects
the capacity of a system to return to an equilibrium state
after being affected and depends on access to resources
and system diversity; and c) stability (ST), which refers
to the frequency of both climatic and non-climatic shocks
and degree of uncertainty affecting the decision-making
environment of the system. Both consistent resource access
and flexibility contribute to a systems´ stability,
that refers to the system’s property of being able
to sustain itself. Thus, all this attributes are inter-related
and together determine a system’s adaptive capacity.
Moreover, as our project interest is with agricultural
producers’ adaptive capacity, and this capacity is
highly differentiated within the sector according to the
type of farms we consider and the different physical sensitivities
of production to climatic risk, we are expressing adaptive
capacity as follows:
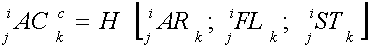
where:
i = 1, 2,..., n and represents specific climatic events.
j = 1, 2,…, m and represents different type of
producers.
k = 1,2,..., w and represents particular geographical
zones to be considered.
c = whether an agricultural productive unit or an agricultural
producer’s livelihood.
Methodologically, assessing agricultural producers’ adaptive
capacity to adverse climatic events rests on the idea that
no single set of indicators can be determined in advance
for analyzing any of its attributes, but rather the indicators
should be defined through both an analysis of existing
literature on the systems of study, and collaborative research
with actors in the system to determine the critical points
that characterize each attribute, specific to the system.
In our case, this means extensive consultations both with
sector experts and with different classes of farmers in
order to identify the appropriate variables that best represent
the attributes of interest for each group and sector. Many
of the indicators identified in the project (see table
below) may also be considered indicators of rural sustainability,
and as such, we hope that although we cannot address all
aspects of sustainability in our vulnerability research,
we will provide a basis from which necessary connections
between future social development and future vulnerability
can be made.
| ATTRIBUTES |
INDICATORS |
| 1. Flexibility (FL) |
|
- Diversity of agricultural system
|
Diversity of seeds available and used; number of
crops planted |
|
|
Diversity of income sources (agriculture, livestock,
off-farm and non-farm) |
- Resource base (endowments) (biological, physical,
human, social, financial)
|
Water supply; soil quality and diversity; land tenure,
size, distribution; financial capital; education and
age; material equipment and machinery ; animals |
| Tendencies and changes in the above |
|
| 2. Stability (ST) |
|
- Exposure to/ impact of market risk
|
Variability in input and output prices and availability |
- Exposure to/ impact of climatic risk
|
Main climatic impacts; agriculture and cattle losses |
- Degree of variability/change in rural economy
|
Migration; land sales, land rental |
| Tendencies and changes in the above |
|
| 3. Resource Access (AR) |
|
- Access to financial resources
|
Formal and informal credit |
- Participation in support programs
|
Technology transfer; technical assistance |
- Participation in social programs
|
Emergency welfare programs, social services |
[1] Masera
y López-Ridaura (2000).
[2] Eakin (2002).
[3] We recognize that these are not
the only attributes of adaptive capacity, but for the purpose
of our research we are using those identified by Eakin
(2002), which explained adaptive capacities of smallholder
farmers in central Mexico.
|
|
| EXAMPLES > Sustainable Livelihoods |
|
|
AF14: Sustainable Livelihoods
Project: Environmental Strategies for Increasing Human
Resilience in Sudan: Lessons for Climate Change Adaptation
in North and East Africa
Sustainable Livelihoods in Sudan
Balgis M. Osman and Nagmeldin Goubti
Sustainable livelihood assessment is intended to generate
an understanding of the role and impact of a project on
enhancing and securing local people’s livelihoods.
The AIACC AF14 project will use the DFID model outlined
below, and the notion of the five capitals (natural, physical,
human, social and financial), albeit loosely, in order
to capture perceptions of resilience in the data collection
process.
DFID’s Sustainable Livelihoods Framework:
The project involves four separate case studies – each
involving travel, fieldwork, data collection, analysis
and writing. Commissioned experts will conduct the research
and writing with the support and close collaboration of
the project partners. It is expected that case study reports
will be prepared in such a way that their results can be
compared and synthesized into a set of project findings.
Given this, it is clearly critical that each case study
researcher closely follows a carefully designed research
protocol, as outlined below.
It is anticipated that each case study will require modest
adaptations of the project’s data collection methods
outlined below, in order to suite the unique community
context. The goal in developing and using this instrument
is to identify the richness of a community’s experience
and avoid reductionism, while at the same time, gathering
comparable information. Nevertheless, it is expected that
the main components of our approach will be applied. Case
study research is divided into four main stages, as outlined
below:
- Background/preparation
- Fieldwork
- Policy analysis
- Progress reporting
- Synthesis
|
|
| EXAMPLES > Cost-Benefit Analysis |
|
[Under Construction]
|
|
| EXAMPLES > Decision Support Systems |
|
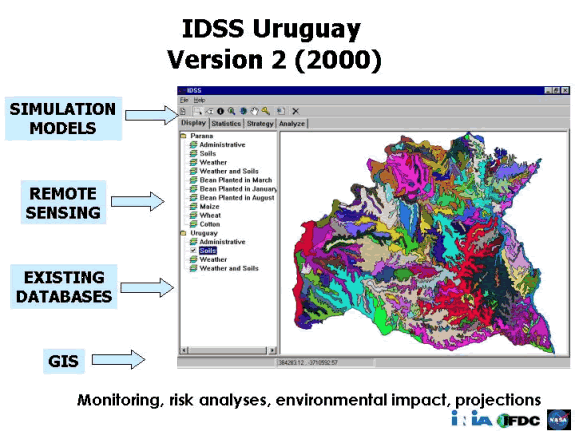
Building Capacity to Assess Impact of Climate Change/Variability
and Develop Adaptive Responses for the Mixed Crop/Livestock
Production Systems in the Argentinean and Uruguayan Pampas
Information and Decision Support
Systems for Agriculture and Climate
Agustin Gimenez and Walter Baethgen
The agricultural community involved in research, development
and production activities in developing countries is facing
two primary challenges. Firstly, the drive for increasing
agricultural productivity in a sustainable basis, i.e.,
increased output per unit area of land in ways that minimize
damage to the environment and the natural resource base.
The second concern is the growing awareness that the constricted
information flows between farmers, researchers, extension
workers, policy makers, and agribusiness personnel are
a serious impediment to achieve sustainable development.
The difficulties raised by these concerns, coupled with
the complexity of most agroecosystems, the necessity of
taking a long term view of biophysical processes, and the
limited research resources available, all contribute to
support the notion that new tools and methodologies are
required to study the problems of sustainable production,
suggest solutions, and assess their impacts at the farm
level.
The agricultural sector in developing countries is confronting
great changes determined by industrialization and modernization,
eliminated subsidies, environmental constraints, land use
conflicts, biotechnology, and increased overall risk. In
this context the availability, accessibility, and application
of relevant agricultural information is of high priority
for policy makers, farmers, technicians, and researchers.
Often the availability of information in the developing
world is not a major limitation: most countries have adequate
research systems generating relevant information. Moving
the relevant information from research centers to extension
agents, policy makers and farmers has been a more frequent
limitation. On the other hand, in many developing countries
stakeholders have increasingly easy access to information
systems through different channels including the Internet.
Difficulties in these cases are often caused by the massive
amount of information and the lack of tools for its analysis
and prioritization that results in a lack of adequate application.
Furthermore, tools are currently available for farmers,
government planners, and decision makers in general that
allow them to obtain and analyze massive quantities of
information and assist them in the planning and decision
making processes. Examples of such tools include among
many others: simulation models, expert systems, remote
sensing, geographic information systems (GIS), global positioning
systems (GPS). However, the main constraint to effectively
use this information is the typical complexity involved
in the application of such tools and the consequent need
for training.
Responding to this challenge, since the early 1990s the
International Soil Fertility and Agricultural Development
Center (IFDC), the National Agricultural Research Institutes
of Uruguay (INIA), Argentina (INTA) and Brazil (Embrapa),
established a workgroup to develop applications of the
Information and Decision Support Systems (IDSS) approach.
Since then this group (IDSS-Uruguay) has been conducting
activities in collaboration with NASA, NOAA, US-EPA, the
International Research Institute for Climate Prediction
(IRI), the Australian group APSRU, the Joint Research Center
(JRC) of the European Commission, and with several Universities
frm the USA (e.g., Colorado, Columbia, Nebraska, Georgia).
Description of the IDSS
The IDSS approach (Figure 3) is based on the linking and
integration of: (a) maps and associated databases (soils,
weather, land use, political divisions, market centers,
routes, rivers); (b) National and regional statistics (production,
socioeconomic, demographic); (c) prices of inputs and products;
(d) remotely sensed acquired information (crops, pastures,
natural resources, climate); (e) simulation models of crop,
pasture and forest growth, development and production;
(f) a decision support system specifically designed for
agro-technology transfer; (g) probabilistic seasonal climate
forecasts; (h) climate change scenarios (GCMs, RCMs and
statistical methods); (i) methods for land use evaluation
and for defining land use feasibility classes; (j) simulation
models of soil carbon and nutrient dynamics and soil erosion;
(k) tools for agricultural applications of global positioning
systems (GPS); and (l) geographic information systems (GIS)
to process and analyze maps and databases and to generate
information that can be easily understandable and applied
by agricultural stakeholders.
The main objective of the IDSS workgroup is:
To develop applications of modern tools for obtaining,
processing and analyzing information to improve agricultural
planning and development and to optimize the use of the
natural resource base. Work is conducted at different spatial
scales (National, regional, farmer groups/communities,
individual farms) and generates results in simple formats
that are easily understandable and applicable by different
types of agricultural stakeholders (government agencies,
International organizations, NGOs, agribusinesses, farmer
organizations, individual farmers).
Examples of activities established by the IDSS workgroup
in Latin America
- Assist governments in the prioritization of aid in
emergency situations (e.g., droughts, floods, frosts)
- Develop applications of seasonal climate forecasts
(e.g. based on El Niño) to improve agricultural
planning and decision-making
- Assess the vulnerability of agricultural production
systems to current climate variability and to possible
future scenarios of climate change
- Identify agricultural production systems best adapted
to current climate variability and to possible future
scenarios of climate change
- Study the environmental impacts resulting of changes
in land use (e.g., introducing annual crops in natural
rangelands, deforestation, water contamination)
- Establish greenhouse gas inventories in the agricultural
and forestry sectors and explore opportunities in the
emerging Carbon Market (Kyoto Protocol) in those sectors
- Establish agroecological zones and land use feasibility
classes for different agricultural activities (summer/
winter crops, pastures, forests)
- Assess variability and risk in agricultural production
to support rural credit and rural insurance programs
- Establish crop and pasture yield forecasts
Figure 3. Structure of the Information
Decision Support System (IDSS)
|
|
| EXAMPLES > Multi-criteria Analysis |
|
SIS06: Multi-criteria
Analysis
Project: The Threat of Dengue Fever - Assessment of Impacts
and Adaptation to Climate Change in Human Health in the
Caribbean
Analytic Methods for Evaluating
Risk of Dengue in the Caribbean
Anthony Chen and Samuel Rawlins
The project integrates several statistical techniques
to evaluate the relative, absolute, and attributable risk
of dengue [1]:
Analysis of Variance (Anova) to evaluate the association
between climate, mosquito densities, dengue cases, seasonal
changes etc.
- Regression analysis to determine changes in time,
space, etc.
- Evaluating epidemiologic association to answer the
following questions: Could the association have been
observed by chance?; Could the association be due to
bias?; Could other confounding variables have accounted
for observed relationship?; To whom does this association
apply?; Does the association represents a cause and effect
relationship?
- Analysis of causation to answer the following questions:
Is there a logical time relationship?; Is there a large
relative risk?; Can we demonstrate a dose-response relationship?;
Is it reversible?; Is it consistently found to be present
in different study sites?; Is it consistent for various
study designs?; Is it biologically plausible?
[1] Relative risk
is a measure of the extent to which those exposed to
a risk factor are likely to get a disease compared with
the non-diseased general population. Absolute risk is
the incidence rate for a group exposed to a risk factor.
Attributable risk is the difference in the incidence
of a disease between the exposed (diseased) and non-exposed
(non-diseased) groups.
|
|
| EXAMPLES > Disaster Analysis |
|
LA06: Disaster Analysis
Project: Assessment of Impacts and Adaptation Measures
for the Water Resources Sector Due to Extreme Events Under
Climate Change Conditions in Central America
Economic Impact of Hydrometeorological
Disasters in Costa Rica
Walter Fernandez and Maxx Campos
The main objective is to determine the economic impact
of disasters originated by hydrometeorological events,
on the economy of Costa Rica during 1996-2001. The types
of disasters covered under this study include: droughts,
floods, river overflows, heat waves, rainy winds, rain
related accidents and landslides. These include 84% of
the total of natural disasters documented in the country
during that same period of time.
For the events documented in each year of the period,
the following aspects were valued:
- Cost of relief (food and supplies, aid, equipment and
removal of debris, etc.)
- Value of homes damaged or destroyed
- Value of reconstruction and/or repair of public schools,
hospitals and clinics
- Cost of repair of meters of length of damaged roads
- Value of damaged bridges and aqueducts
- Value of losses in agriculture hectares of damaged
crops and other measures officially reported
- Cost of medical attention to victims and evacuees
- Cost of relocation of families
- Value of death and missing persons based on the working
years potentially lost of those individuals under 65
years
The series show a decreasing trend after 1998 (Figures
4 and 5), due in part to the reduction of deaths, and because
of the reduction of the intensity of the events considered.
The study findings show that the average annual value
of the damages caused by hydrometeorological disasters
was 57,498,036,184 colones, the currency in Costa Rica
(US $ 146,305435.5), and represent a 1.15% of the GDP of
Costa Rica. Considering the estimate of losses in agricultural
crops, in relation to the total national agricultural production
(agricultural, silvicultural and fisheries GDP), the annual
average represents 1.5% of the agricultural GDP.
The direct values (medical attention to victims, compensation
of agricultural losses) reach an annual average of 18,778,124,609
colones (US$ 47,781487.5), which represent a 3% of the
central government annual revenues. This amount is what
the considered hydrometeorological events should require
for its relief and compensation for damages and infrastructure.
The estimated values for investment in roads, bridges,
aqueducts and damaged or destroyed buildings and facilities,
represent a high opportunity cost for the country’s
economic development options and social welfare. This amount
is more or less, the equivalent to the investment in 30
new rural aqueduct systems, 157 bridges, near 425 Km of
road systems, and more than 50 rural school buildings of
three rooms each. Therefore, this values are appropriate
indicators of the benefits foregone by the country in social
and economic investments, in exchange of replacing the
investments damages or destroyed by a recurrent hydrometeorological
events in the five year period.
For those disasters whose magnitudes require an official
declaration for state of emergency, a regulation plan is
required. This entails appointing executing agencies (governmental
entities, local governments, and local organizations) and
developing an investment plan. The National Commission
for Emergencies (CNE) is responsible for the accounting
of the executed funds in the items described in the investment
plan for each event. Such accounting is systematized since
1998, and the average annual expenditures amount to 1,586,904587
colones (US$ 4,037925.5), which represent only 17.3% of
the total reported damages (Table 1).
The estimates respond to the data base available in different
sources. Its important to consider that such information
is not generated in a systematic or continuous fashion.
Due to this condition, the estimates are based in indirect
criteria and logical assumptions. This suggests the need
to develop a database that enables authorities and researchers
to have an accurate information of what hydrometeorological
events may imply in economic terms and to what it forgoes
when disasters are recurrent.
Figure 4. Number of Events and Valuation
of Total Damage
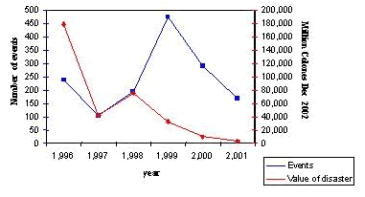
Figure 5. Damages by hydrometeorological
events as percentage of GDP

Table 1. Coverage of expenditure in repair
and reconstruction as part of the total direct cost (in
2003 colones). *Adjusted for inflation to 2003 current
colones.
| Year |
Expenditure |
Direct costs* |
% coverage |
| 1,998 |
1,783,640,654 |
27,796,080,588 |
6.42% |
| 1,999 |
1,303,013,364 |
9,655,023,425 |
13.50% |
| 2,000 |
1,135,753,469 |
3,598,794,108 |
31.56% |
| 2,001 |
458,245,383 |
2,583,279,245 |
17.74% |
| Average |
|
|
17.30% |
Sources of information and databases: La Red, 2002.
Base de datos Des inventar, versión 5.4.1. 30 enero.
http://www.desenredando.org
Office for Disaster Assistance (OFDA) USAID
AS06: Disaster
Analysis
Project: Potential Impacts of Climate Change and Vulnerability
and Adaptation Assessment for Grassland Ecosystem and Livestock
Sector in Mongolia
Disaster Analysis in Mongolia
Punsalmaa Batima
Following the principle indicated in “An Adaptation
Policy Framework” the Mongolia project is concerned
with climate variability and extreme events. In the past
impact and vulnerability in livestock sector and country
socio-economy was more measurable when occur natural disasters
caused by meteorological extreme events. Other reason to
study extremes is that the government highlights prevention
and mitigation of risk of natural disasters like Dzud,
drought, wind- and snowstorm that have affected country
socio-economy, human lives and livelihood of thousands
of households since 1999.
The main objectives of case study are to:
- Quantify extreme meteorological event and livestock
sector components
- Logical definition and formula of interrelationships
between components
- Quantified assessment of hazard, vulnerability and
risk
- Compare assessment results with actual losses
- Evaluate recommendations and adaptation policy options
We studied two cases with different in temporal scale:
- Dzud disaster, which is a complex and continues process
with losses of millions of animals, serious disruption
of agriculture and country socio-economy, affect households’ income,
and increase unemployment and poverty. Usually it covers
big area and starts in summer with drought, hot wave,
continued for autumn, winter and spring with extreme
cold, heavy snowfall and harsh windstorm. Recovery of
losses is continued for years. Mongolia has been under
Dzud pressure since 1999. Mitigation measures are more
important.
- Windstorm disaster, which is a complex, but sudden
process, covers big area with high danger spots, affects
human lives, animal losses, environment, infrastructure,
houses and shelters. Warning and preparedness measures
are important.
The case study of Dzud was done in 2001 within UNDP funded
project MON/00/302 to meet government requirement to have
a recommendation for development of policy on prevention
and mitigation of natural disaster. As the study yielded
with the recommendation, basing on it the government of
Mongolia developed a Programme “Assisting to protect
livestock against drought and Dzud disaster” and
now implementing it with state fund financing. International
organizations and donors starting to support some development
projects that address local capacity building to prevent
and mitigate natural disasters. As an example of success
story of research work and its implementation this case
can be useful for climate change study in three ways:
- For development of methodology to assess impacts, vulnerability,
and link with government short- and mid-term objectives
- For development of recommendations and policies
- For development of tactics to work with government
and other stakeholders and deliver outputs of research
work (recommendation and adaptation policy) to them to
achieve immediate follow-up reaction with real activities
and financing mechanisms
The case study includes the following components:
- To test a simplified methodology for relative assessment
of hazard, vulnerability and risk which is designed to
rank administrative units by level of facing danger.
It is to be as the first step toward to assessment of
vulnerability of livestock sector under non-linear, extreme
events of climate.
- To assess early warning and emergency system of Mongolia
on the example of windstorm disaster and develop a recommendation
for further improvement.
The first component is for climate change study, while
the other is required for Disaster Management Board of
Mongolia and the launching by government and UNDP project “Strengthening
of disaster Mitigation and Management System in Mongolia”.
Such integration could happen as the result of close collaboration
of climate change researchers with disaster management
authorities and international organization.
|
|
| CLIMATE SCENARIOS |
|
climate
scenarios table
|
| |
| |
| Funding for the AIACC
Data, Methods & Synthesis Activity website is
provided by the U.S. Agency for International Development
(USAID). The opinions
expressed are those of the author(s) and do not necessarily
reflect the views of USAID. The site is designed
and
hosted by SEDAC.
Copyright© 2004 The Trustees of Columbia
University in the City of New York. |
 |
 |
 |
 |
 |
| |
|
|
|
|
|