Data Sets » Format: vectorRemove Facet
1 of 4
Prev | Next

Daily 8-Hour Maximum and Annual O3 Concentrations for the Contiguous United States, 1-km Grids, v1.10 (2000 – 2016)

Air Quality Data for Health-Related Applications

To provide daily 8-hour maximum and annual ground-level Ozone (O3) concentration data in the U.S. at a resolution of 1-km (about 30 arc-seconds) for public health research to respectively estimate short- and long-term effects on human health, and for other related research.

Daily and Annual PM2.5 Concentrations for the Contiguous United States, 1-km Grids, v1.10 (2000 – 2016)

Air Quality Data for Health-Related Applications

To provide daily and annual PM2.5 concentration data in the U.S. at a resolution of 1-km (about 30 arc-seconds) for public health research to respectively estimate short- and long-term effects on human health, and for other related research.

Daily and Annual NO2 Concentrations for the Contiguous United States, 1-km Grids, v1.10 (2000 – 2016)

Air Quality Data for Health-Related Applications

To provide daily and annual Nitrogen Dioxide (NO2) concentration data in the U.S. at a resolution of 1-km (about 30 arc-seconds) for public health research to respectively estimate short- and long-term effects on human health, and for other related research.

SDG Indicator 7.1.1: Access to Electricity, 2023 Release (2020 – 2022)

Sustainable Development Goal Indicators (SDGI)

To provide national and subnational estimates of SDG indicator 7.1.1, the proportion of the population with access to electricity, produced using global open data.

SDG Indicator 11.2.1: Urban Access to Public Transport, 2023 Release (2015 – 2022)

Sustainable Development Goal Indicators (SDGI)

To provide urban center level estimates of the proportion of population that has convenient access to public transportation.

SDG Indicator 9.1.1: The Rural Access Index (RAI), 2023 Release (2015 – 2022)

Sustainable Development Goal Indicators (SDGI)

To provide national and subnational estimates of SDG indicator 9.1.1, which measures the proportion of the rural population who live within 2 kilometers of an all-season road.

SDG Indicator 11.7.1: Urban Public Space, Availability and Access, 2023 Release (2015 – 2022)

Sustainable Development Goal Indicators (SDGI)

To provide urban center level estimates of the average share of the built-up area of cities that is open space for public use for all.

Yale Center for Earth Observation (YCEO) Surface Urban Heat Islands, v4 (2003 – 2018)

Satellite-Derived Environmental Indicators

To provide global estimates of the surface urban heat island intensity from monthly, seasonal, to annual scales for over 10,000 urban clusters developed using a simplified urban-extent algorithm.

Daily and Annual NO2 Concentrations for the Contiguous United States, 1-km Grids, v1 (2000 – 2016)

Air Quality Data for Health-Related Applications

To provide daily and annual Nitrogen Dioxide (NO2) concentration data in the U.S. at a resolution of 1 km (about 30 arc-seconds) for public health research to respectively estimate short- and long-term effects on human health, and for other related research.

Groundswell Spatial Population and Migration Projections at One-Eighth Degree According to SSPs and RCPs, v1 (2010 – 2050)

Climate Migration

To provide a data set that allows users to understand how slow-onset climate change impacts on water availability and crop productivity, coupled with sea-level rise and storm surge, may affect the future population distribution and climate-related internal migration in low to middle income countries.

Annual PM2.5 Concentrations for Countries and Urban Areas, v1 (1998 – 2016)

Satellite-Derived Environmental Indicators

To provide an annual global surface of concentrations (micrograms per cubic meter) of mineral dust and sea-salt filtered fine particulate matter of 2.5 micrometers or smaller (PM2.5) in countries and urban areas for large-scale health and environmental research

Global High Resolution Daily Extreme Urban Heat Exposure (UHE-Daily), v1 (1983 – 2016)

Satellite-Derived Environmental Indicators

To provide a high-resolution, longitudinal global data set of extreme urban heat events and urban heat exposure.

Georeferenced U.S. County-Level Population Projections, Total and by Sex, Race and Age, Based on the SSPs, v1 (2020 – 2100)

Population Dynamics

To provide subnational (county) population projection scenarios for the United States essential for understanding long-term demographic changes, planning for the future, and decision-making in a variety of applications.

Urban Extent Polygons, v1.02 (1995)

Global Rural-Urban Mapping Project (GRUMP), v1

To provide a polygon representation of urban areas with city or agglomeration name and time series population estimates.

Daily and Annual PM2.5 Concentrations for the Contiguous United States, 1-km Grids, v1 (2000 – 2016)

Air Quality Data for Health-Related Applications

To provide daily and annual PM2.5 concentration data in the U.S. at a resolution of 1 km (about 30 arc-seconds) for public health research to respectively estimate short- and long-term effects on human health, and for other related research.

Daily 8-Hour Maximum and Annual O3 Concentrations for the Contiguous United States, 1-km Grids, v1 (2000 – 2016)

Air Quality Data for Health-Related Applications

To provide daily 8-hour maximum and annual ground-level Ozone (O3) concentration data in the U.S. at a resolution of 1 km (about 30 arc-seconds) for public health research to respectively estimate short- and long-term effects on human health, and for other related research.

Latin America and the Caribbean Population Time Series, v1 (1990, 2000)

Population Dynamics

To describe changing population distribution and growth in Latin America and the Caribbean using spatially consistent and comparable units at a spatial resolution suitable to regional change analysis.

Spatial Data from the 2011 India Census, v1 (2011)

India Data Collection

To provide high-resolution population and urban classification data for India for 2011.

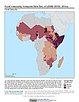
Food Insecurity Hotspots Data Set, v1 (2009 – 2019)

Food Security

To provide gridded data that identify the level of intensity and frequency of food insecurity over the 10 years between 2009 and 2019, as well as hotspot areas that have experienced consecutive food insecurity events, based on FEWS NET Food Security Data.

Subset of OpenStreetMap Roads, v1 (2014)

West Africa Coastal Vulnerability Mapping

To provide roads linking rural production to urban markets in the coastal zone of West Africa that represent an important exposed infrastructure asset.

Data Sets » Format: vectorRemove Facet
1 of 4
Prev | Next