Data Sets (41)
|
1 of 3
Prev
|
Next
|
U.S. Climate Risk Projections by County, v1 (
|
Groundswell Africa Spatial Population and Migration Projections at One-Eighth Degree According to SSPs and RCPs, v1 (
|
|
Annual Global High-Resolution Extreme Heat Estimates (GEHE), v1 (
|
Yale Center for Earth Observation (YCEO) Surface Urban Heat Islands, v4 (
|
|
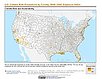
U.S. Social Vulnerability Index Grids, v1.01 (2000, 2010, 2014, 2016, 2018, 2020)U.S. Census Grids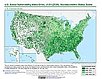
To provide a 1 km grid of the CDC Social Vulnerability Index (SVI) aligned with CIESIN's Gridded Population of the World, Version 4, Revision 11 (GPWv4.11) with a mask for water and no population. |
Global Gridded Relative Deprivation Index (GRDI), v1 (
|
|
Urban-Rural Population and Land Area Estimates, v3 (1990, 2000, 2015)Low Elevation Coastal Zone (LECZ)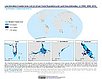
To provide estimates of urban and rural populations and land areas for the years 1990, 2000, 2015 for 234 countries and statistical areas with contiguous coastal elevations of less than or equal to 5m above sea level, 5-10m above sea level, and national totals using multiple updated data sources for comparative analysis. |
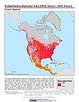
Global Human Modification of Terrestrial Systems, v1 (2016)Land Use and Land Cover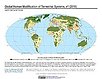
To provide a cumulative measure of human modification of terrestrial lands based on modeling the physical extents of 13 anthropogenic stressors and their estimated impacts using spatially-explicit global data sets. |
|
Global Development Potential Indices, v1 (2016)Land Use and Land Cover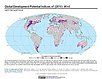
To provide spatially-explicit data that relatively rank global land suitability referred to as Development Potential Indices (DPIs) for 13 sectors related to renewable energy, fossil fuels, mining and agriculture as an aid to conservation priority setting. |
Food Insecurity Hotspots Data Set, v1 (
|
|
Altimeter Corrected Elevations (ACE2), v2 (
|
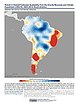
Trends in Global Freshwater Availability from the Gravity Recovery and Climate Experiment (GRACE), v1 (
|
|
Subset of Global Mammal and Amphibian Richness Grids, 2015 Release (2013)West Africa Coastal Vulnerability MappingTo provide areas of higher richness of threatened species which may be at risk from climate stressors in the coastal zone of West Africa. |
Subset of High and Low Resolution Altimeter Corrected Elevations 2 (ACE2), v1 (
|
|
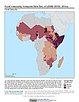
Social Vulnerability Indices, v1 (1997, 2005, 2008, 2010, 2013)West Africa Coastal Vulnerability MappingTo provide a measure of social vulnerability and "defenselessness" in the face of climate stressors in the coastal zone of West Africa. |
Subset of JRC Map of Accessibility, v1 (
|
|
GPWv4 Population Growth Preliminary Release, v1 (
|
Population Projections, v1 (2030, 2050)West Africa Coastal Vulnerability MappingTo provide areas in West Africa that may be particularly exposed to climate stressors owing to future high population growth. |
|
GPWv4 Population Density Preliminary Release, v1 (2010)West Africa Coastal Vulnerability MappingTo provide areas in the coastal zone of West Africa that may be particularly exposed to climate stressors owing to high population density. |
Demographic and Health Survey Data Sets, v1 (
|
|
1 of 3
Prev
|
Next
|