Gridded Population of the World (GPW), v4
Introduction
The Gridded Population of the World (GPW) collection, now in its fourth version (GPWv4), models the distribution of human population (counts and densities) on a continuous global raster surface. Since the release of the first version of this global population surface in 1995, the essential inputs to GPW have been population census tables and corresponding geographic boundaries. The purpose of GPW is to provide a spatially disaggregated population layer that is compatible with data sets from social, economic, and Earth science disciplines, and remote sensing. It provides globally consistent and spatially explicit data for use in research, policy-making, and communications.
For GPWv4, population input data are collected at the most detailed spatial resolution available from the results of the 2010 round of Population and Housing Censuses, which occurred between 2005 and 2014. The input data are extrapolated to produce population estimates for the years 2000, 2005, 2010, 2015, and 2020. A set of estimates adjusted to national level, historic and future, population predictions from the United Nation's World Population Prospects report are also produced for the same set of years. The raster data sets are constructed from national or subnational input administrative units to which the estimates have been matched. GPWv4 is gridded with an output resolution of 30 arc-seconds (approximately 1 km at the equator).
The nine data sets of the current release are collectively referred to as the Revision 11 (or v4.11) data sets. In this release, several issues identified in the 4.10 release of December 2017 have been corrected as follows:
- The extent of the final gridded data has been updated to a full global extent.
- Erroneous no data pixels in all of the gridded data were recoded as 0 in cases where census reported known 0 values.
- The netCDF files were updated to include the Mean Administrative Unit Area layer, the Land Area and Water Area layers, and two layers indicating the administrative level(s) of the demographic characteristics input data.
- The National Identifier Grid was reprocessed to remove artifacts from inland water. In addition, two attributes were added to indicate the administrative levels of the demographic characteristics input data, and the data set zip files were corrected to include the National Identifier Polygons shapefile.
- Two new classes (Total Land Pixels and Ocean Pixels) were added to the Water Mask.
- The administrative level names of the Greece Administrative Unit Center Points were translated to English.
Separate rasters are available for population counts and population density consistent with national censuses and population registers, or alternative sources in rare cases where no census or register was available. All estimates of population counts and population density have also been nationally adjusted to population totals from the United Nation’s World Population Prospects: The 2015 Revision. In addition, rasters are available for basic demographic characteristics (age and sex), data quality indicators, and land and water areas. A vector data set of the center point locations (centroids) for each of the input administrative units and a raster of national level numeric identifiers are included in the collection to share information about the input data layers.
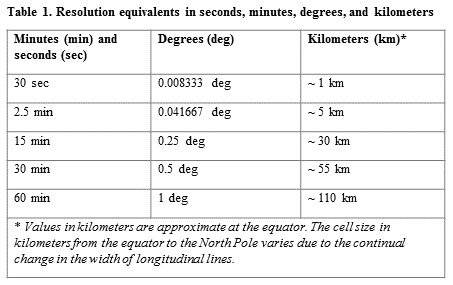
The raster data sets are now available in ASCII (text) format as well as in GeoTIFF format. Five of the eight raster data sets are also available in netCDF format. In addition, the native 30 arc-second resolution data were aggregated to four lower resolutions (2.5 arc-minute, 15 arc-minute, 30 arc-minute, and 1 degree) to enable faster global processing and support of research communities that conduct analyses at these resolutions (Table 1). All of these resolutions are available in ASCII and GeoTIFF formats. NetCDF files are available at all resolutions except 30 arc-second. All spatial data sets in the GPWv4 collection are stored in geographic coordinate system (latitude/longitude). Additional details on the improvements made for Revision 11 can be found on the web page What’s New in Revision 11.
The GPW data collection is licensed under the Creative Commons Attribution 4.0 International License (http://creativecommons.org/licenses/by/4.0), thus providing openly-available, gridded population data that maintains fidelity to the input census data. This is an advantage of GPW because minimally modeled census information may be analyzed in conjunction with other data sets, such as land cover and elevation, without concern for endogeneity, or double counting. See the FAQ page for more details.
See the FAQ page for more details or watch the brief intro video to learn what′s new in GPWv4.
To see the previous version of GPW, visit the GPWv3 data collection.