In the Spotlight

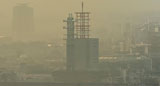
Data Use - Fine Particulate Air Pollution and Diabetes
The Lancet Planetary Health – July 13, 2018
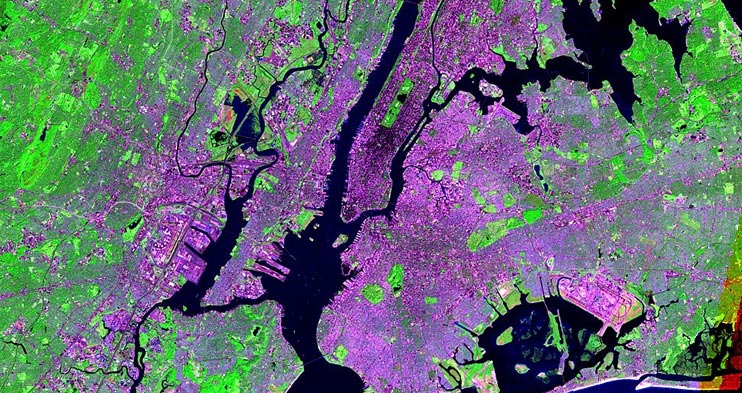
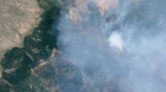
Using satellite-based Global Annual PM2.5 Grids from MODIS, MISR and SeaWiFS Aerosol Optical Depth (AOD), v1 from SEDAC to uncover the relationship between air pollution and type 2 diabetes.
Using satellite-based Global Annual PM2.5 Grids from MODIS, MISR and SeaWiFS Aerosol Optical Depth (AOD), v1 from SEDAC to uncover the relationship between air pollution and type 2 diabetes.
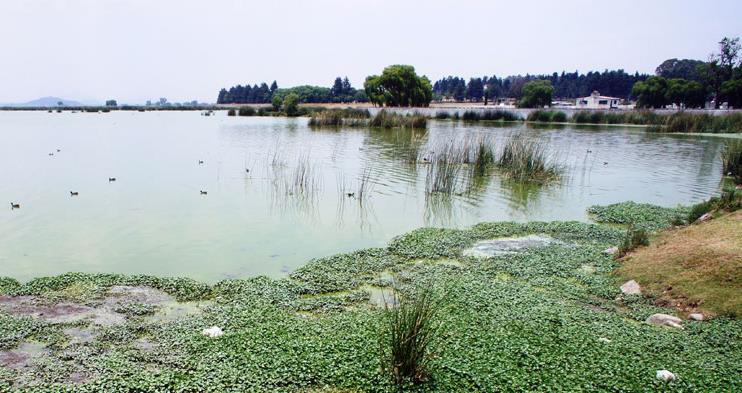
Data Use - Closed Season - Land Subsidence and Groundwater
Sensing Our Planet – July 3, 2018
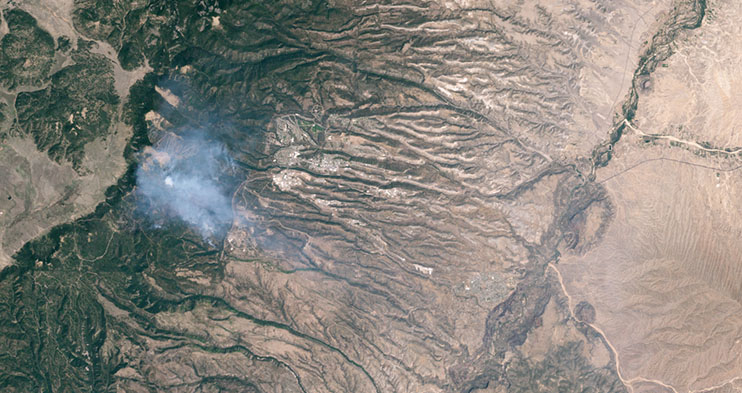
Population data from SEDAC combined with NASA satellite imagery to examine groundwater storage and land subsidence in Mexico.
Population data from SEDAC combined with NASA satellite imagery to examine groundwater storage and land subsidence in Mexico.


Data Use - Population, Storm Energy and Tornado Casualties
Geophysical Research Letters - April 30, 2017
SEDAC Gridded Population of the World (GPW) v4 data were used in an examination of the population and energy elasticity of tornado casualties.
SEDAC Gridded Population of the World (GPW) v4 data were used in an examination of the population and energy elasticity of tornado casualties.
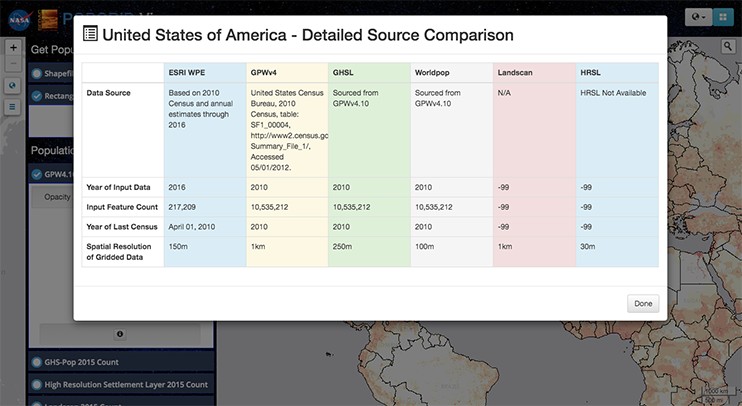
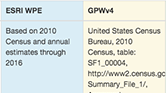
Tools and Apps - POPGRID Viewer
Web-based application that enables direct comparison of different population data sets based on different data sources and methodologies.
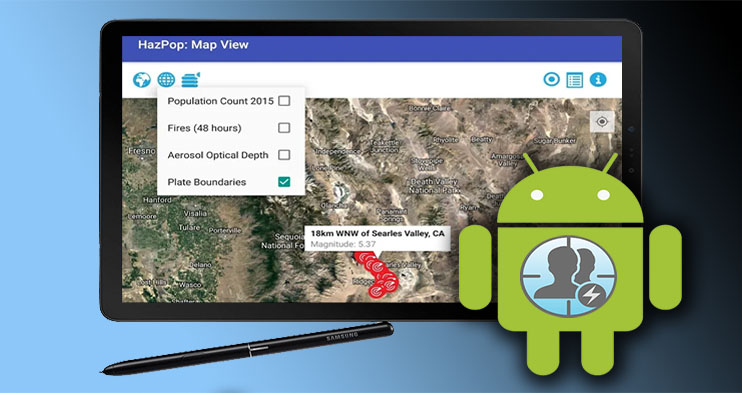

Tools and Apps - SEDAC Hazards and Population Mapper - Android
The Hazards and Population Mapper (HazPop), Android version, is a free mobile application that enables users to easily display recent natural hazard data in relationship to population, major infrastructure, and satellite imagery.


Tools and Apps - SEDAC Citations Database
A searchable database of all identified publications that cite data distributed by the NASA Socioeconomic Data and Applications Center (SEDAC).
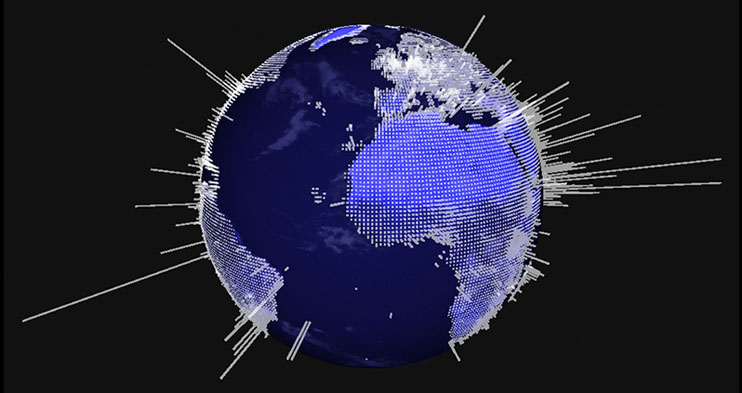
Theme - Population Distribution and Change
Find data sets, maps, map services, featured uses of data and other resources related to Population Distribution and Change.


Theme - Poverty and Economic Indicators
Find data sets, maps, map services, featured uses of data and other resources related to Poverty and Economic Indicators.
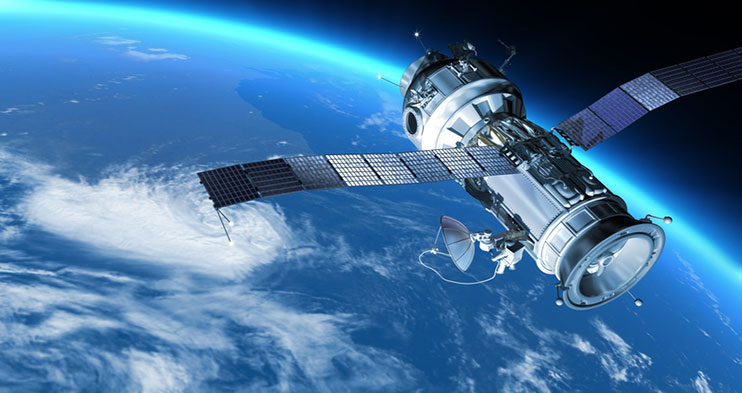
Theme - Applications of Satellite Remote Sensing
Find data sets, maps, map services, featured uses of data and other resources related to Applications of Satellite Remote Sensing.

Resource - POPGRID Data Collaborative
POPGRID aims to bring together and expand the international community of data providers, users, and sponsors concerned with georeferenced data on population, human settlements and infrastructure.
Resource - NASA Webinar: Mapping Urban Areas
This cyberseminar looked at Mapping Global Urbanization using Landsat and High-Resolution Reference Data.

Resource - Introduction to SEDAC Data and Services
An introduction to the data products and services offered by the NASA Socioeconomic Data and Applications Center (SEDAC).


Map Gallery - Poverty Mapping
Global Subnational Infant Mortality Rates, Version 2
A map collection featuring infant mortality rates as of 2015
A map collection featuring infant mortality rates as of 2015
Map Gallery - Satellite-Derived Environmental Indicators
Trends in Global Freshwater Availability from the Gravity Recovery and Climate Experiment (GRACE)
A map collection featuring freshwater availability data derived from the Gravity Recovery and Climate Experiment (GRACE), 2002-2016.
A map collection featuring freshwater availability data derived from the Gravity Recovery and Climate Experiment (GRACE), 2002-2016.


Map Gallery - Land Use and Land Cover
Land Use and Land Cover
A map collection featuring terrestrial development threats produced by aggregating individual habitat threats such as agricultural expansion, urban expansion, mining, and energy (oil and gas, coal, biofuels, solar, and wind) development.
A map collection featuring terrestrial development threats produced by aggregating individual habitat threats such as agricultural expansion, urban expansion, mining, and energy (oil and gas, coal, biofuels, solar, and wind) development.
Featured Data Sets More...
|
|