Marc L. Imhoff
NASA Goddard Space Flight Center
Greenbelt, Maryland
Kimberly E. Baugh, Vinita Ruth Hobson, Ingrid Nelson
Cooperative Institute for Research in Environmental Sciences
University of Colorado, Boulder, Colorado 80303
John B. Dietz
Cooperative Institute for Research on Atmosphere
Colorado State University, Fort Collins, CO
February 11, 2000
Submitted to the ISPRS Journal of Photogrammetry and Remote Sensing
ABSTRACT
The Defense Meteorological Satellite Program (DMSP) Operational Linescan System (OLS)
has a unique low light imaging capability developed for the detection of clouds using moonlight.
In addition to moonlit clouds, the OLS also detects lights from human settlements, fires,
gas flares, heavily lit fishing boats, lightning and the aurora. By analyzing the location,
frequency, and appearance of lights observed in an image time series, it is possible to
distinguish four primary types of lights present at the earth's surface: human settlements,
gas flares, fires, and fishing boats. We have produced a global map of the four types of
light sources as observed during a six month time period in 1994-95. We review a number
of environmental applications that have been developed or proposed based on the nighttime
lights data. We examine the relationship between area of lighting, population, economic
activity, electric power consumption, and energy related carbon emissions for 200 nations,
representing 99% of the world's population.
Keywords: nighttime lights, global map, cities, fires, gas flares.
Much of global change research is dedicated to discerning and documenting the impacts of human activities on natural systems. Human population numbers have expanded from ~750 million in the mid-1700's, hitting 6 billion in 1999, and could nearlydouble in the next 50 years if current growth continues (Haub and Cornelius, 1998). Human activities which are known to be cumulatively altering the global environment include greenhouse gas emissions from fossil fuel consumption, biomass burning, air and water pollution, and land cover / land use change.
Far from being evenly distributed across the land surface, to a great extent human activities with environmental consequences are concentrated in or near human population centers. Having a capability for frequent global observation of a widespread and distinctly human activity that varies in intensity could substantially improve understanding of the scale of human enterprise and modeling its impact on the environment. Satellites sensors with high frequency global data acquisition capabilities have generally focused on the observation of natural systems as their design criteria. As an alternative, we have been investigating the nocturnal observation of manmade lighting as a measure or indicator of human activity using data collected by the U.S. Air Force Defense Meteorological Satellite Program (DMSP) Operational Linescan System (OLS). This instrument has a low-light imaging capability, which was designed for the observation of clouds illuminated by moonlight. In addition to moonlit clouds, the data can be used to detect light sources present at the earth's surface.
Time series data from the DMSP-OLS have been used to derive a global image map showing light sources that were observed during a six month period spanning 1994-95. The time series analysis makes it possible to separate ephemeral events such as fire and to normalize for differences in the number of cloud-free observations. The light sources have been divided into four categories: human settlements (cities, towns, villages, industrial sites), gas flares, fires, and heavily lit fishing boats. An examination of the lit area from human settlements (km2) for 200 countries indicates the OLS derived products may be used to perform the spatial apportionment of population and energy related greenhouse gas emissions.
In addition to presenting the global map, we review a number of the applications which have been developed or proposed for DMSP-OLS nighttime lights observations.
Since the early 1970's the U.S. Air Force Defense Meteorological Satellite Program has operated polar orbiting platforms carrying cloud imaging satellite sensors capable of detecting clouds using two broad spectral bands: visible - near infrared (VNIR) and thermal infrared (TIR). The program began with the SAP (Sensor Aerospace Vehicle Electronics Package) which were flown from 1970-76. The current generation of OLS sensors began flying in 1976 and are expected to continue flying until ~2010. At night the VNIR band is intensified with a photomultiplier tube to permit detection of clouds illuminated by moonlight. Examples of visible and thermal band OLS data are shown in Figure 1.
The DMSP program was declassified in 1972 and shortly after this the low light detection of cities, fires, fishing boats and gas flares was described by Croft (1973, 1978, 1979). Figure 1 and 2 provides examples of nighttime OLS data exhibiting these types of light sources. From 1972 to 1992 digital DMSP data were not archived and all scientific access to the data was through OLS film archived at the University of Colorado, National Snow and Ice Data Center. A digital archive for the DMSP-OLS data was established in mid-1992 at the NOAA National Geophysical Data Center.
The Operational Linescan System (OLS) is an oscillating scan radiometer designed for cloud imaging with two spectral bands (VIS and TIR) and a swath of ~3000 km. The "VIS" bandpass straddles the visible and near-infrared (VNIR) portion of the spectrum (0.5 to 0.9 um). Satellite attitude is stabilized using four gyroscopes (three axis stabilization), a star mapper, Earth limb sensor and a solar detector. The OLS VIS band signal is intensified at night using a photomultiplier tube (PMT), for the detection of moonlit clouds. Nighttime passes of the DMSP typically occur between 20:30 and 21:30 local time. The low light sensing capabilities of the OLS at night permit the measurement of radiances down to 10-9 watts/cm2/sr/um. This is more than four orders of magnitude lower than the OLS daytime and comparable bands of other sensors, such as the NOAA AVHRR or the Landsat Thematic Mapper.
There are two spatial resolution modes in which data can be acquired. The full resolution data, having nominal spatial resolution of 0.5 km, is referred to as "fine". On-board averaging of five by five blocks of fine data produces "smoothed" data with a nominal spatial resolution of 2.7 km. Most of the data received by NOAA-NGDC is in the smooth spatial resolution mode.
The potential use of DMSP-OLS data for the inventory of human settlements and energy consumption patterns has been noted since the 1980's (Welch, 1980 and Foster, 1983). Sullivan (1989) produced a 10 km resolution global image of OLS observed VNIR emission sources using film data. The global map published by Sullivan (1989) was derived from single dates of OLS imagery, selected based on the presence of large number cloud-free VNIR emission sources and mosaiced into a global product. As a result, many of the features presented in areas such as Africa are ephemeral VNIR emissions from fires. These early studies with OLS data relied on the analysis of film strips, which limited the quantity of data which could be incorporated into the studies.
Nighttime DMSP-OLS data from 984 orbits acquired during the dark half of lunar cycles between October 1, 1994 and April 30, 1995 were extracted from the digital archive and processed to generate a georeferenced map of the nighttime lights of the world. Our objective in using the large number of orbits over an extended period of time was to ensure that majority of areas had at least twenty cloud-free observations. We use data acquired with less than 50% lunar illumination for two reasons: 1) During these nights the VNIR band gain on the OLS is set to its highest monthly level, permitting detection of smaller light sources present on the Earth's surface. And 2) With low levels of lunar illumination it is possible to avoid inclusion of moonlight reflectance off of clouds and water, which can be confused with VNIR emissions present at the earth's surface. Typical OLS gain settings are at a level which results in saturated visible band data for major cities and gas flares. Therefore the resulting products indicate the location and frequency of observation for light sources, but not the actual brightness.
The processing algorithms and steps in the processing chain are described in detail in Elvidge et al. 1997a. Two changes in the original algorithms have been implemented for the processing used for the current product. We have expanded the image cell used to identify the background values in setting the local threshold for light detection. The original cell was 50 by 50 pixels. This cell size, corresponding to a ground coverage of 135 by 135 kilometers proved to be too small in areas where there is extensive areas of lighting, such as the Nile Delta. The result was an under detection of lights in these areas. To remedy this problem the light detection processing cell was expanded to 100 by 100 pixels. The other major difference in the processing was a shift to the use of a 30 arc second grid instead of the previously used Interrupted Goode Homolosine Projection 1 km equal area grid in the generation of nighttime light products.
The processing chain is summarized in Figure 3. The first processing chain operates upon the raw OLS data. In this processing chain clouds are identified using the OLS thermal band data. Lights are identified relative to the local background. Data that are unusable due to aurora, glare, and solar contamination are automatically identified. The results of these operations are recorded in a image band which directly overlays the OLS image, referred to as a flag file. The final step in this processing chain is to georeference the flag files. The second processing chain incorporates the assembly of global composites of flag file results and operations made on the global composites. This includes the generation of a composite indicating the total number of valid observations (Figure 4). A second composite is made counting the total number of cloud observations. By subtracting the number of cloud observations from the total number of cloud free observations an image indicating the total number of cloud free observations is generated (Figure 5).
A separate composite is made counting the number of cloud-free light detections (Figure 6). In addition to lights from the earth's surface the counts image (Figure 6) also contains strips of light detection from the edges of aurora (primarily in high northern latitudes) and glare introduced by the detection of sunlight scattered off the DMSP platform. There is also a random noise pattern centered over the Atlantic Ocean east of Brazil. This noise pattern is the result of the spacecraft's passage through a belt of high energy particles present in the ionosphere, known as the South Atlantic Anomaly. Most of the noise and aurora strips can be removed by deleting single detections from the counts image.
For generation of the stable lights, the counts image is filtered to remove noise by deleting all counts less than three. The counts-greater-than-two image is converted into a percent frequency image by dividing by the total number of cloud-free observations and multiplying by 100. The next step in the processing chain is to extract the "stable" lights using a 10% detection frequency threshold.
The final processing steps involve manual editing and threshold filtering to separate the lights into four categories. The editing is done on a computer screen displaying the stable lights, counts, shorelines, and populated place points from Digital Chart of the World. Fires are extracted from the counts image, identified based on their low frequency of occurrence, diffuse spatial pattern, and location on land surface. To avoid inclusion of noise, only pixels with counts greater than one were included in the fire product. Boats were extracted from the counts data using a processes identical to fires, except with location being on water surfaces. Gas flares are identified in the stable lights data based on the on their large circular appearance and lack of coincidence with populated places. Offshore gas flares can be identified with little ambiguity. Heavily lit oil and gas platforms have been lumped with gas flares in offshore environments. Human settlements were taken to be all remaining stable lights present on the land surface following the removal of obvious gas flares. The resulting image map of the nighttime lights of the world is shown in Figure 7.
Fires: Fires were widely observed on land surfaces during the six month time period analyzed and several dense regional clusters of fires were observed. This includes the Sahel region of Africa, south of the Sahara Desert (Figure 8a), Southeast Asia (Figure 8b), Australia (Figure 8c), and northern South America (Figure 8d). Fires were observed up to latitudes of 60 degrees in the northern hemisphere, indicating that DMSP's fire detection capabilities are not limited to tropical and temperate regions. The dearth of fire detection in places such a Brazil and southern hemisphere Africa can be attributed to the fact that the analysis window was optimized for the northern hemisphere (October through March) and missed the primary burning season in these areas.
Fishing Boats: Large clusters of heavily lit fishing boats were detected in the waters surrounding Japan, including the Sea of Japan, Pacific Ocean waters off of northern Japan, Yellow Sea, the Formosa Straight, and East China Sea (Figure 9a). Other parts of Asia having large numbers heavily lit fishing boats include the Gulf of Tonkin, Gulf of Thailand, and near-shore waters of the Andaman Sea (Figure 9b), and many areas in the Philippines. In the South Atlantic Ocean large numbers of fishing boats were detected along the continental shelf offshore from Argentina (Figure 9c). Smaller clusters of fishing boats were detected offshore from northern Peru, on the Agulhas Bank at the southern tip of Africa, and in waters near New Zealand.
Gas Flares: Gas flares and heavily lit offshore oil and gas platforms were observed in the Persian Gulf (Figure 10). Other areas with large numbers of conspicuous gas flares include the Arabian Peninsula, North Africa, coastal Nigeria and Angola, the North Sea, and Siberia. Smaller sets of offshore or island gas flares were observed offshore from Bombay, Louisiana, Brunei, Viet Nam, Southern California, Brazil, and Java. Gas flares were also observed onshore at Prudoe Bay, Alaska.
Human Settlements: Although the scale of reproduction in Figure 7 is vastly reduced from the original image size (43,200 by 21,600) it is still possible to discern aggregations of lights from human settlements in the more densely populated regions of Europe, North America and Asia. Full resolution images of human settlements in the region surrounding the Nile River delta and the northeastern USA are shown in Figure 11a and 11b. In examining the full resolution data it is clear that major cities are detected in every region of the world. Many cities were detected in 90 to 100% of the cloud-free observations. However, smaller towns were detected with less frequency, in some cases only 10-20% of the time. The are several countries that have very few lights relative to their known population numbers, such as North Korea and Afghanistan, however these anomalies can be explained by their unusual social and economic conditions.
What is not well defined are the population detection limits of the data. We have examined population in the State of Colorado, USA and found that the population detection limit for small towns is approximately 200 inhabitants. Figure 12 shows a graph of population number versus area of lighting for Colorado towns with populations less that 5000. Towns with no lights detected have populations less than 200. Nine towns with populations in the 100-200 were detected. All of the towns in Colorado with populations greater than 200 were detected. Because the extent to which lighting is used is highly dependent on economic factors we expect that the population detection limits would be substantially higher in less developed areas of the world.
The data in Figure 12 can be used to make two significant observations about the nighttime lights data. First, the area of lighting observed is an overestimate of the actual size of human settlements. This area overestimation is combination of the large OLS pixel size, the OLS' capability to detect subpixel light sources, geolocation errors. Surface effects, such as the presence of snowcover and the reflection of onshore lighting by near shore waters also contribute to the spread of light that can be detected by the satellite. These effects, present in data from single observations, are accumulated during the time series analysis. Imhoff et al. (1997) developed thresholding techniques to accurately map urban areas. However, these techniques eliminate lights from small towns due to their low frequency of detection.
Another phenomena that can be observed in Figure 12 is the spread in area estimates relative to population numbers. In examining the identity of the high and low outliers in Figure 12 we found that towns with extensive commercial development to have more area of lighting than isolated farming communities.
Given these capabilities to detect human population centers, we have examined the relationship between the observed area of lighting in 200 countries and administrative units versus population, Gross Domestic Product (GDP), electric power consumption, and energy related carbon emissions. Population and GDP values were extracted from the 1995 CIA World Factbook. Electric power consumption and carbon emissions were extracted from the U.S. Department of Energy, Energy Information Administration.
Figure 13 shows a log-log scale plot of population versus area of lighting. There is a general trend, with the area of lighting expanding as population increases. The USA has the largest area of lighting from human settlements (1,261,570 km2) and has an anomalously high level of lighting. Other countries that have anomalously high levels of lighting relative to their population numbers include prosperous countries at high latitudes (Canada, Sweden, Norway, Finland, Iceland) and several countries on the Arabian Peninsula (United Arab Emirates, Oman, Kuwait). Outliers with low area lit values relative to population are largely countries with poorly developed economies, such as Nigeria, Bangladesh, Ethiopia, Afghanistan, Uganda, Cambodia, Rwanda, Somalia, Burundi, Togo, Bhutan, and Equatorial Guinea.
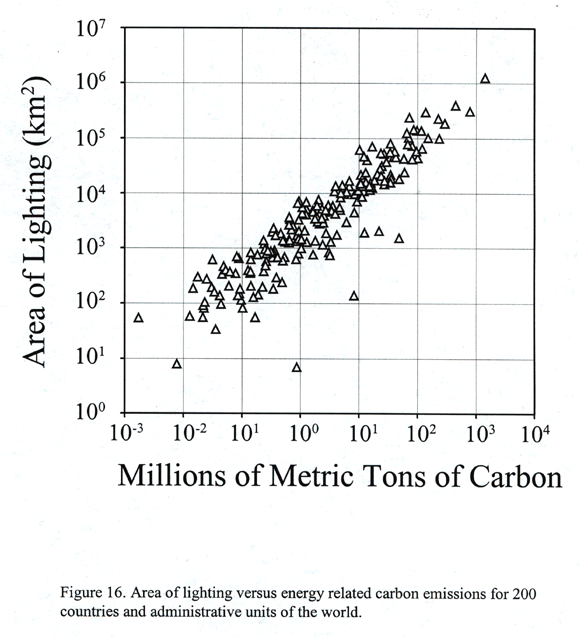
When area lit is compared to GDP on a log-log plot (Figure 14) a more linear relationship is observed, with fewer outliers. A similar pattern holds when area lit is compared to electric power consumption (Figure 15) and energy related carbon emissions (Figure 16).
Nocturnal lighting could be regarded as one of the defining features of concentrated human activity. The authors have developed a methodology for producing georeferenced images indicating location and extent of human settlements based on satellite observations of visible light emission sources present at the Earth's surface at night. The digital method for mapping nighttime lights with OLS data utilizes large numbers of orbits to overcome the obscuring effects of clouds and to separate the observed lights into four primary categories: human settlements, gas flares, fishing boats, and ephemeral lights (mostly fires).
A number of environmental monitoring activities are being developed using nighttime OLS data. All of these applications benefit from having period long term composites, such as the one presented in this paper. Below is a brief description of the environmental applications for which OLS data are being developed or for which significant potential appears to exist.
Gas Flares: Gas flaring represent approximately 5% of world gas production which is wasted and adds to the carbon dioxide loading on the atmosphere. Oil and gas companies are under increasing pressure to end the wasteful practice of gas flaring by either marketing the gas or reinjecting it into their wells. OLS observations of gas flares may provide useful information for confirming the shutdown of gas flaring or in estimating the volume of gas being lost through flaring.
Biomass Burning: The OLS is not the only satellite sensor capable of fire detection. The majority of fires start during the hot part of the day when ignition conditions are at their peak. Fires may burn briefly and many fires burn out or die back with the onset of dusk. Fires that burn into the night are generally out of control and represent the most dangerous and destructive class of fires. By detecting fires at night, the OLS provides a valuable capability to observe the worst fires in terms of fire management and resource protection. DMSP-OLS data have been used to map seasonal fire patterns in Africa (Cahoon et al., 1992) and annual patterns in Madagascar (Elvidge et al., 2000a). DMSP observations of fires were used forensically to estimate forest burn area and to understand the sequence of events in the devastating fires which hit Roraima, Brazil in 1998 (Elvidge et al., 2000b).
Fishing Boats: The detection of heavily lit fishing boats by the OLS provides a unique basis for tracking local and international squid fishing activity (Cho et al., 1999 and Rodhouse et al., 2000). The level of this activity can likely be used to estimate and track squid numbers. Squid are short-lived ecological opportunists whose population numbers are known to be readily affected by events such as El Nino. In some parts of the world there is evidence that as fin-fish stocks have collapsed through overfishing, squid numbers have increased due to release from predation and the opening of ecological niches. The collapse of many traditional fisheries has resulted in increased effort to harvest squid. In this sense recent increases in squid harvests can be viewed as humanity progress in working down the food chain. The tracking of squid fishing may provide valuable information relative to the sustainable management of other species, since squid are an important food resource for many oceanic higher predators including seabirds, seals and whales, especially in the southern hemisphere.
Human Settlements: One approach to modeling the spatial distribution of human activities is to use population density as an indicator for the phenomenon of interest (e.g. the percent coverage of impermeable surfaces). There are two primary disadvantages to using population density as an indicator for human activities with environmental consequences. At a global level, population density is not well characterized over most of the world. Currently available global population density grids cover 60 square kilometers per data cell (Tobler et al., 1995), far too coarse for many environmental applications. In areas where high spatial resolution population density data sets are available the environmental applicability of the data suffer due to the fact that population density is defined as a residential parameter. As a result transportation corridors, public, commercial and industrial zones have very low population density. In many cases these areas have much higher densities of people present eight to twelve hours a day than the associated residential zones. Thus the use of population density as an indicator for percent of land area covered by impermeable surface (roads, roofs, parking lots) would result in a substantial skewing of the results towards residential areas.
The OLS low-light imager provides a global set of remote sensing observations of a uniquely human activity - artificial lighting, which is concentrated in human settlements. The full set of applications for these data have yet to be realized. Below we will review the applications and analyses that have been performed on nighttime lights data of human settlements provide by NGDC.
The nighttime lights data of human settlements could be combined with other data (e.g. topography, hydrography and land cover) to generate high resolution population density grids. Preliminary studies indicate that this will provide more detailed and more accurate depictions of population density than the currently available data sets. Imhoff et al. (1997a and 1997b) used the stable lights to estimate the extent of land areas withdrawn from agricultural production. Sutton et al. (1997 and 1998) examined the potential use of the stable lights data to spatially apportion population.
Meteorological records extending back decades from ground stations in urban settings are of dubious value in analyzing climate change due to the growth of urban heat islands as the urban areas expanded. This problem is serious given that many of the stations that began recording data in rural environments have been encroached upon or enveloped in urban sprawl. Gallo et al. (1995) and Owen et al. (1998) used nighttime lights to assess urban heat island impacts on meteorological records. By plotting the location of recording stations on top of the nighttime lights data they have been able to identify which records are most heavily influenced by the urban heat island effect. Their ultimate objective is to remove the urban heat island influence on these records so that they may be pooled with records from observing stations in rural settings.
Light pollution has reduced the visibility of the stars and planets to millions of people worldwide. The night sky of our ancestor's inspired much of the wonder and creativity that lead to civilization. Degradation in astronomical viewing conditions has forced many observatories to relocate and substantially limits the value of many of the pioneering telescope facilities. Cinzano et al. (2000) used radiance calibrated nighttime lights (Elvidge et al., 1999a) to model the distribution and intensity of light pollution at the Earth's surface across Europe.
The quantity of sprawl development which has occurred in the past 20-30 years is staggering, particularly in the United States. From 1970-90 the population of greater Chicago grew by 4%, but the developed area grew by 50%. For cities and towns in the U.S. there is typically a 6 to 12% increase in developed area for each 1% of population growth. It is anticipated that the pattern of sprawl development in the U.S. will continue in the coming decades. The nighttime lights data provides perhaps the best continental to global scale depictions of urban sprawl. The World Resources Institute (Revenga et al., 1998) has used nighttime lights to assess the level of development present in major watersheds of the world. We anticipate that the nighttime lights could be used to analyze the impacts of urban sprawl on the environment. For instance, they could be used to model the spatial extent of constructed material (buildings, roads, parking lots). This information could in turn be used to model the impacts of sprawl development on terrestrial carbon dynamics and alter the hydrologic properties of the land surface. The nighttime lights data could also be used to assess the impact of urban sprawl on biodiversity. A recent study (Salmon et al., 2000 a and b) confirms the aversion of sea turtles to nesting on heavily lit beach fronts based on DMSP nighttime lights.
Several studies have noted the high correlation between the area or brightness of human settlements observed with DMSP data and energy related trace gas emissions (Elvidge et al., 1997b, Elvidge et al., 1997c, Doll et al., 2000). The results suggest that the spatial distribution of carbon dioxide (CO2) emissions from distributed fossil fuel consumption could be modeled based on nighttime lights data. By distributed sources we refer to the consumption of fossil fuel by vehicles and in buildings of various types. The nighttime lights would not provide an accurate depiction of emissions from major point sources, such as electric power generation facilities. The high spatial resolution depiction of the spatial distribution of CO2 emissions from fossil fuel consumption has two primary applications: 1) Improved inverse modeling to estimate the magnitude of regional land-atmosphere and ocean-atmosphere fluxes, and 2) evaluating the validity of national trace gas emission estimates as reported under the United Nations Framework Convention on Climate Change and the Kyoto Protocol, as suggested by Saxon et al., 1997).
DMSP nighttime lights data have also been used to detect power outages following hurricanes, earthquakes, and other disasters (Elvidge et al., 1999b). Because of the availability of nightly observations, DMSP data could be used to measure the reliability of electric power generation and delivery systems. A related application would be to use the data to track and monitor the effectiveness of rural electrification programs.
The incredible low-light imaging capabilities provided by the DMSP program are expected to continue until at least the year 2010. The NOAA-DoD converged system of meteorological sensors (NPOESS), scheduled for deployment towards the end of this decade, will preserve the low light sensing capability initiated with the OLS. Thus the mapping of light sources present at the earth's surface using nighttime satellite data can be expected to be a continuing source of information for the coming decades.
The author's gratefully acknowledge the U.S. Air Force DMSP Program Office and the Air Force Weather Agency for providing the data used to construct the nighttime lights of the world. This research was supported in part by the NASA EOS Interdisciplinary Science (IDS) Project: Assessing the Impact of Expanding Urban Land Use on Agricultural Productivity Using Remote Sensing Data and Physically-Based Soil Productivity Models.
Cahoon, D.R. Jr., Stocks, B.J., Levine, J.S., Cofer, W.S. III, O'Neill, K.P., 1992, Seasonal distribution of African savanna fires. Nature, v. 359, p.812-815.
Cho, K., Ito, R., Shimoda, H., Sakata, T., 1999, Fishing fleet lights and sea surface temperature distribution observed by DMSP/OLS sensor. International Journal of Remote Sensing, v. 20, p. 3-10.
Cinzano, P., Falchi, F., Elvidge, C.D., Baugh, K.E., 2000, The artificial night sky brightness mapped from DMSP satellite Operational Linescan System measurements. Submitted to Monthly Notices of the Royal Astronomical Society.
Croft, T.A., 1973, Burning waste gas in oil fields. Nature, v. 245, p. 375-376.
Croft, T.A., 1978, Nighttime images of the earth from space. Scientific American, v. 239, p. 68-79.
Croft, T.A., 1979, The brightness of lights on Earth at night, digitally recorded by DMSP satellite. Stanford Research Institute Final Report Prepared for the U.S. Geological Survey.
Doll, C.N.H., Muller, J-P., Elvidge, C.D., 2000, Night-time imagery as a tool for global mapping of socio-economic parameters and greenhouse gas emissions. Ambio, In Press.
Elvidge, C.D., Baugh, K.E., Kihn, E.A., Kroehl, H.W, Davis, E.R, 1997a, Mapping of city lights using DMSP Operational Linescan System data. Photogrammetric Engineering and Remote Sensing, v. 63, p. 727-734.
Elvidge, C.D., Baugh, K.E., Kihn, E.A., Kroehl, H.W, Davis, E.R, Davis, C., 1997b, Relation between satellite observed visible - near infrared emissions, population, and energy consumption. International Journal of Remote Sensing, v. 18, p. 1373-1379.
Elvidge, C.D., Baugh, K.E., Hobson, V.H., Kihn, E.A., Kroehl, H.W., Davis, E.R., Cocero, D., 1997c, Satellite inventory of human settlements using nocturnal radiation emissions: A contribution for the global toolchest. Global Change Biology, v. 3, p. 387-395.
Elvidge,C.D., Baugh, K.E., Dietz, J.B., Bland, T., Sutton, P.C., Kroehl, H.W. 1999a, Radiance calibration of DMSP-OLS low-light imaging data of human settlements. Remote Sensing of Environment, v. 68, p. 77-88.
Elvidge, C.D., Baugh, K.E., Hobson, V.R., Kihn, E.A., Kroehl, H.W., 1999b, Detection of Fires and Power Outages Using DMSP-OLS Data. Chapter 8 in Lunetta, R.S. and Elvidge, C.D., Remote Sensing Change Detection: Environmental Monitoring Methods and Applications. Ann Arbor Press, p. 123-135.
Elvidge, C.D., Nelson, I., Hobson, V.R., Baugh, K.E., Safran, J., 2000a, Detection of Fires At Night Using DMSP-OLS Data. Submitted to Remote Sensing of Environment.
Elvidge, C.D., Hobson, V.R., Baugh, K.E., Dietz, J., Shimabukuro, Y.E., Krug, T., Novo, E.M.L.M., Echavarria, F.R., 2000b, DMSP-OLS estimation of rainforest area impacted by ground fires in Roraima, Brazil: 1995 versus 1998, submitted to the International Journal of Remote Sensing.
Foster, J.L., 1983, Observations of the Earth using nighttime visible imagery. International Journal of Remote Sensing, v. 4, p. 785-791.
Gallo, K.P., J.D. Tarpley, A.L. McNab, and T.R. Karl. 1995. Assessment of urban heat islands: a satellite perspective. Atmospheric Research. 37: 37-43.
Haub, C. and Cornelius, D., 1998, The 1998 World Population Data Sheet. Population Reference Bureau, Inc., Washington DC.
Imhoff, M.L., Lawrence, W.T., Stutzer, D.C., Elvidge, C.D., 1997a, A Technique for Using Composite DMSP/OLS "City Lights" Satellite Data to Accurately Map Urban Areas. Remote Sensing of Environment, v . 61, p. 361-370.
Imhoff, M.L., Lawrence, W.T., Elvidge, C., Paul, T., Levine, E., Prevalsky, M., Brown, V., 1997b, Using nighttime DMSP/OLS images of city lights to estimate the impact of urban land use on soil resources in the U.S. Remote Sensing of Environment , v .59, p. 105-117.
Revenga, C., Murray, S., Abramovitz, J., Hammond, A., 1998, Watersheds of the World: Ecological Value and Vulnerability. World Resouces Institute, Washington, DC.
Rodhouse, P.G., Elvidge, C.D., Trathan, P.N., 2000, Remote sensing of the global fishing fleet: an analysis of interactions with oceanography, other fisheries and predators. Submitted to Advances in Marine Biology.
Salmon, M., Witherington, B.E. and Elvidge C.D., 2000a. Artificial lighting and the recovery of sea turtles in Florida, U.S.A. Proceedings of the Second ASEAN Symposium and Workshop on Sea Turtle Biology and Conservation, Kota Kinabalu, Malaysia (In Press).
Salmon, M., Witherington, B.E. and Elvidge C.D., 2000b, Does Artificial Light Determine the Location of Florida's Sea Turtle Rookeries? Proceedings of the Twentieth Annual Symposium on Sea Turtle Biology and Conservation, Orlando, Florida, U.S.A. (In Press).
Saxon, E.C., Parris, T. and Elvidge, C.D., 1997, Satellite Surveillance of National CO2 Emissions From Fossil Fuels. Harvard Institute for International Development (Harvard University), Development Discussion Paper No. 608.
Sullivan, W.T. III, 1989, A 10 km resolution image of the entire night-time Earth based on cloud-free satellite photographs in the 400-1100 nm band. International Journal of Remote Sensing, v. 10, p. 1-5.
Sutton, P., D. Roberts, C. Elvidge, and H. Meij, 1997, A Comparison of nighttime satellite imagery and population density for the continental United States. Photogrammetric Engineering and Remote Sensing, vol. 63, p. 1303-1313.
Sutton, P., D. Roberts, C. Elvidge, and J. Leskow, 1998, Modeling Urban Population Density with Nighttime Satellite Imagery. In Review at International Journal of Geographic Information Science.
Tobler, W., Deichmann, U., Gottsegen, J., and Maloy, K., 1995, The Global Demography Project, National Center for Geographic Information and Analysis, University of California, Santa Barbara, Technical Report 95-6.
Welch, R., 1980, Monitoring urban population and energy utilization patterns from satellite data. Remote Sensing of Environment, v. 9, p. 1-9.
Figure 1. Visible and thermal band DMSP-OLS imagery of Italy acquired the night of December 30, 1999.
Figure 2. In addition to city lights, the OLS low light imaging data can be used to detect heavily lit fishing boats, fires, and gas flares.
Figure 3. Outline of processing steps used to generate the nighttime lights of the world.
Figure 4. Total number of DMSP-OLS observations used to generate the nighttime lights of the world.
Figure 5. Total number of cloud-free observations used to generate the nighttime lights of the world.
Figure 6. Counts image, compiled by counting the number of cloud-free light detections in the time series.
Figure 7. Nighttime lights of the world: white = human settlements, red = ephemeral lights (primarily fires), green = gas flares, and blue = heavily lit fishing boats.
Figure 8a. Fires observed in northern Africa.
Figure 8b. Fires observed in Southeast Asia.
Figure 8c. Fires observed in Australia.
Figure 8d. Fires observed in northern South America.
Figure 9a. Heavily lit fishing boats in the Japan region.
Figure 9b. Heavily lit fishing boats in Southeast Asia.
Figure 9c. Heavily lit fishing boats in South Atlantic Ocean.
Figure 10. Gas flares in the Persian Gulf region.
Figure 11a. Lights detected from human settlements in the Nile River delta and surrounding region.
Figure 11b. Lights from human settlements along the eastern shores of the USA.
Figure 12. Area of lighting versus population for towns in Colorado with populations less than 5000.
Figure 13. Area of lighting versus population for 200 countries of the world.
US = United States, CH = China, IN = India, RS = Russia, BR = Brazil,
CA = Canada, ID = Indonesia, SW = Sweden, NO = Norway, FI = Finland,
TC = United Arab Emerites, MU = Oman, KU = Kuwait, IC = Iceland,
NI = Nigeria, BG = Bangladesh, BM = Myanmar, ET = Ethiopia,
AF = Afghanistan, UG = Uganda, CB = Cambodia, RW = Rwanda,
SO = Somalia, BY = Burundi, TO = Togo, BT = Bhutan,
EK = Equitorial Guinea, GI = Gibraltar.
Figure 14. Area of lighting versus GDP for 200 countries of the world.
Figure 15. Area of lighting versus electric power consumption for 200 countries of the world.
Figure 16. Area of lighting versus energy related carbon emissions for 200 countries and administrative units of the world.