Global: Remote Sensing for Ramsar Sites
by Earth Satellite Corporation (EarthSat)
Web: http://www.earthsat.com/ArcIMS/ramsar_world
I. Introduction
The Earth Satellite
Corporation, together with Isciences LLP, produced a report in
early 2002 entitled Monitoring Environmental Agreements: Ramsar
Convention Feasibility Study. The purpose was to examine the
utility of remote sensing imagery for wetland identification and
delineation. The feasibility study also evaluated current and
forthcoming imagery in terms of its utility for monitoring vegetative
health, drainage and infilling, encroachment by agriculture, and
pollutant discharges. This study did not focus on a single wetland,
but rather on a number of pilot applications. These included the
Quill Lakes in Saskatchewan, Canada; Donana and Marismas wetlands
in Andalucía (southern) Spain; Lake Naivasha in Kenya; and the
Shadegan Marshes and the Mudflats of Khor-al Amaya & Khor
Musa in western Iran near the Gulf.
The study also outlined
potential techniques to enhance data delivery using an Internet-based
mapping system that would provide access to critical data for
Ramsar sites, such as, location, boundary and baseline land cover.
2. Methods and result
The imagery used in the
feasibility analysis focused on Landsat MSS, TM and ETM data.
These platforms were chosen for their ability to provide consistent
historical datasets for the temporal analysis of wetland change
over the period studied. The focus on Landsat data was also due
in part to availability as well as its affordability. For the
purpose of the feasibility analysis, the dates of imagery ranged
from 1974 through 2000 with the primary focus being placed on
data gathered in the last 15 years.
Remote sensing techniques
were demonstrated for identifying wetlands and documenting current
conditions (necessary to determine wetlands appropriate for potential
suitability for Ramsar site designation) and to evaluate change
from prior conditions (for potential inclusion in the Montreux
Record of threatened sites). EarthSat has developed an imagery-based
technique to measure the degree of change called Cross-Correlation
Analysis (CCA) (US patent # 5719949). There are two general types
of Cross-Correlation Analysis: one evaluates a satellite image
against polygons delineating the historical land use or land cover;
the other uses two different dates of imagery and compares spectral
difference between the two. CCA assigns a statistical measure
of the degree of change to each data point or pixel. Both methods
provide quantification of the likelihood of change in land use.
CCA presents a methodology for detecting change without requiring
specific knowledge about the study area although, as with all
interpretation, an experienced analyst will make more informed
decisions about setting the thresholds that define significant
change (see Figures 1 and 2).
The main purpose of this
study focused on satellite imagery and monitoring techniques on
a site-by-site basis. One of the important lessons discovered
through this investigation was the potential use of imagery in
conjunction with GIS datasets (infrastructure and settlements)
to investigate the interconnectivity of wetland sites within a
larger geographic region. This type of regional analysis would
greatly enhance capabilities to assess and understand the environment
as a whole instead of an isolated entity. On a regional scale
the impacts of wetland degradation as related to migratory bird
flights could be closely monitored.
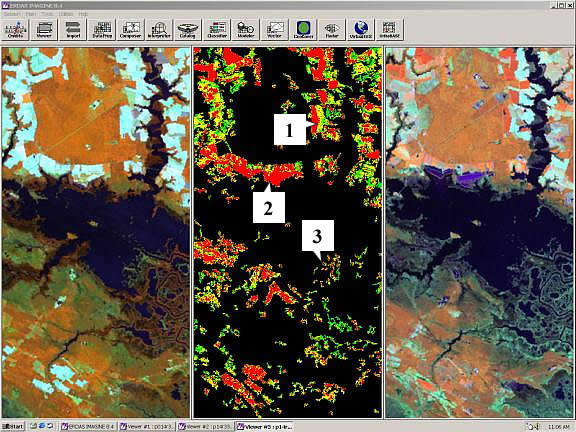
Figure
1. Chesapeake Bay, Virginia, USA, in close proximity to the
Ramsar site of the same name. The figure shows Landsat imagery
for 1988 (left) and 1998 (right). Areas of potential change identified
by cross-correlation analysis are in the center image. Red areas
indicate the highest probability of change; yellow areas have
a lower probability; green indicates moderate probability. Notes
in the central image indicate: (1) conversion of forest to agriculture,
(2) conversion of wetland vegetation to shallow water, and (3)
decrease in wetland vegetation.
Remote sensing, with supporting
ground truth data, can identify wetland areas and monitor the
general health and extent of wetland vegetation. The hydrologic
environment can be monitored and mapped using various remote sensing
techniques and allows for the quantification of the water resources
supporting wetlands. Distribution of algal blooms, invasive species,
and overall water quality measures may be able to be obtained
from remotely sensed data and that in turn can be used to estimate
the carrying capacity of a wetland to support bird and fish species.
Remotely sensed data can be used to monitor international flyways
to check on the health and status of wetlands along the routes
that are important to migratory water birds. The digital nature
of remote sensing data allows for the analysis and manipulation
of the observations to identify and measure changes in wetlands
due to encroachment, pollution, and urbanization or expansion
due to sea level rise. Although remotely sensed data can not replace
in-field measurements and observations, it can provide a uniform
base layer and cost effective (and consistent) means for monitoring
the over 1,000 Ramsar listed sites. Table 1 provides a matrix
of the remote sensing instruments currently or soon to be available
with spectral ranges and detection capabilities of interest to
the Ramsar convention.
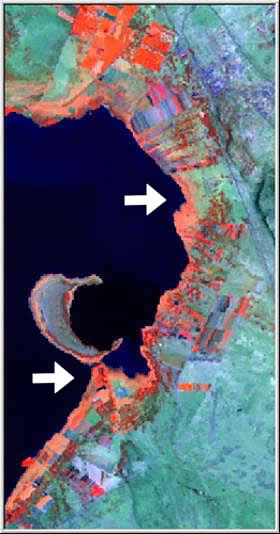
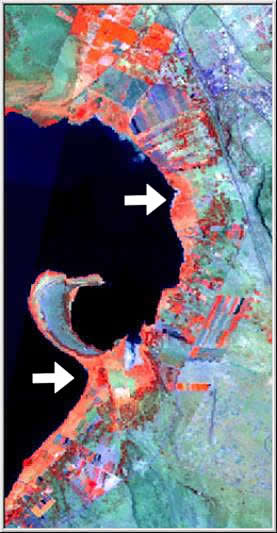
Figure
2. Lake Naivasha, Kenya. Landsat imagery from January 1986
(left) and February 1987 (right). Lake Naivasha supports a diversity
of natural and human activities and was one of the Ramsar Wetland
Conservation Award winners in 1999. The dramatic change between
the two Landsat images, taken 13 months apart during the growing
season, may be related to natural fluctuations in the hydrologic
cycle. These images demonstrate the importance of understanding
the environment when defining a significant threshold of change.
The remote sensing imagery
used in the feasibility analysis focused on moderate (30 meter)
resolution Landsat data. Wetlands of limited extent, less than
50 hectares, will not be adequately imaged using Landsat alone.
Currently, there are less than 20 such sites on the Ramsar list.
However for these smaller wetlands an alternative image base of
finer resolution, IKONOS at 1-meter or aerial remote sensing at
0.3-meter resolution may be required. Higher resolution data such
as IKONOS or aerial data are much more limited in coverage, have
a higher overall cost, and do not have an easily usable historical
database. Many areas, including Ramsar sites, have not yet been
imaged using space-based 1-meter platforms and scheduling a satellite
to obtain an image on a given day is costly and time consuming.
However, with sufficient lead-time, small wetlands can be targeted
for data collection.
Identifying threats to
a wetland and remediation planning often requires more specific
knowledge about a wetland than can be derived from imagery alone.
In many instances the ecological conditions of a wetland are being
affected by political and economic factors as well as development
trends and population shifts. Since most threats to wetland health
are likely to originate outside of the wetland, monitoring for
wise use includes observation of the surrounding watershed and
the socio-economic factors that may affect it.
Currently, the technical
capability, base data and online mapping capacity are all sufficiently
developed to build a Ramsar monitoring system for all existing
Ramsar sites. Table 1 demonstrates that many sensors are already
available for measuring important wetlands-relevant parameters.
3. Conclusions and future directions
EarthSats ongoing efforts
in the field of environmental remote sensing are multi-faceted.
Under current contracts with NASA, EarthSat is providing global
orthorectified Landsat datasets in three epics c. 1980, c. 1990
and c. 2000 through the GeoCover program. The expected availability
for the 1980 and 1990 datasets is December 2002 and the 2000 datasets
in the summer of 2003. In addition to the GeoCover program, EarthSat
is deriving a worldwide 13-class land cover dataset based on the
orthorectified 1990 and 2000 Landsat data. The GeoCover LC will
be the first consistently prepared, moderate-resolution land cover
(LC) database for the world. This information will provide a baseline
for scientists and decision-makers to track environmental changes
worldwide.
New hyperspectral sensors
with over 200 bands will eventually allow a users to differentiate
between land uses to a much finer degree and to monitor vegetative
health in greater detail. Impacts on vegetation due to air pollution,
reduced water quality, and encroachment of urbanization will be
observable within the next five years. However, it should be noted
that with this increase in definition will come added reliance
on the skill of the image analyst, and may also increase the subjective
nature of the analysts opinion on land use changes.
Advances in radar technology
will allow for finer resolution monitoring of water resources.
Currently the RADARSAT satellite records reflected microwave data
at resolutions varying from 8 meters to 100 meters. Microwave
radiation is attenuated by water and, using existing radar satellite
data, soil moisture can be monitored in shallow soil profiles
as well as pooled on the surface. [see
table 1(html) or table1
(image)]
back to Case Studies Table
|