SRES emissions scenarios
The IPCC published a new set of scenarios in 2000 for use in the Third Assessment Report (Special Report on Emissions Scenarios - SRES). The SRES scenarios were constructed to explore future developments in the global environment with special reference to the production of greenhouse gases and aerosol precursor emissions. They use the following terminology:
- Storyline: a narrative description of a scenario (or a family of scenarios), highlighting the main scenario characteristics and dynamics, and the relationships between key driving forces.
- Scenario: projections of a potential future, based on a clear logic and a quantified storyline.
- Scenario family: one or more scenarios that have the same demographic, politico-societal, economic and technological storyline.
The SRES team defined four narrative storylines (see Figure 1), labelled A1, A2, B1 and B2, describing the relationships between the forces driving greenhouse gas and aerosol emissions and their evolution during the 21st century for large world regions and globally . Each storyline represents different demographic, social, economic, technological, and environmental developments that diverge in increasingly irreversible ways.
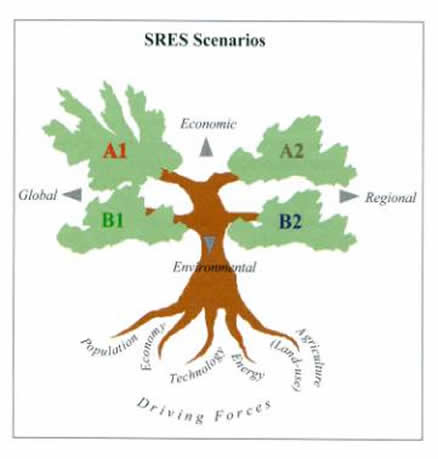
Figure 1: Schematic illustration of the four SRES storylines
In simple terms, the four storylines combine two sets of divergent tendencies: one set varying between strong economic values and strong environmental values, the other set between increasing globalization and increasing regionalization . The storylines are summarized as follows (Nakicenovic et al., 2000):
- A1 storyline and scenario family: a future world of very rapid economic growth, global population that peaks in mid-century and declines thereafter, and rapid introduction of new and more efficient technologies.
- A2 storyline and scenario family: a very heterogeneous world with continuously increasing global population and regionally oriented economic growth that is more fragmented and slower than in other storylines.
- B1 storyline and scenario family: a convergent world with the same global population as in the A1 storyline but with rapid changes in economic structures toward a service and information economy, with reductions in material intensity, and the introduction of clean and resource-efficient technologies.
- B2 storyline and scenario family: a world in which the emphasis is on local solutions to economic, social, and environmental sustainability, with continuously increasing population (lower than A2) and intermediate economic development.
After determining the basic features of each of the four storylines, including quantitative projections of major driving variables such as population and economic development taken from reputable international sources (e.g. United Nations, World Bank and IIASA), the storylines were then fully quantified using integrated assessment models, resulting in families of scenarios for each storyline. In all 40 scenarios were developed by six modelling teams. All are equally valid, with no assigned probabilities of occurrence. Six groups of scenarios were drawn from the four families: one group each in the A2, B1 and B2 families, and three groups in the A1 family, characterising alternative developments of energy technologies: A1FI (fossil intensive), A1T( predominantly non-fossil) and A1B (balanced across energy sources). Illustrative scenarios1 were selected by the IPCC to represent each of the six scenario groups.
The DDC provides quantitative listings of the SRES scenarios, as well as an interpretation - using the same simple models as were used with the IS92 scenarios above - of what these different scenarios signify for future global temperature and sea-level change. The assumptions underlying these emissions scenarios (i.e. population, economic growth, etc.) are also described.
The final and complete SRES scenario data can be viewed and downloaded following the link below. (Version 1.1 of the GHG emissions associated with the 40 SRES scenarios provided here are not completely identical to those in Appendix VII of the SRES report as published by Cambridge University Press (2000). In a small number of cases slight corrections were made after the publication of the document to prevent negative emissions which occurred as a result of the standardization procedure. The changes, which were necessary in just a few scenarios and future years, were relatively small. The corrected numbers presented here are recommended for use in further impacts, adaptation and mitigation analysis. The final gridded emissions data for sulfur dioxide, methane, carbon monoxide, nitrous oxides, and non-methane VOCs in the six illustrative scenarios were based on the version 1.1. emissions.)
SRES Final Data Tables
SRES Final Data Tables in HTML-format and Excel-format
Reference:
Nakicenovic, N. et al (2000). Special Report on Emissions Scenarios: A Special Report of Working Group III of the Intergovernmental Panel on Climate Change, Cambridge University Press, Cambridge, U.K., 599 pp. Available online at: http://www.grida.no/climate/ipcc/emission/index.htm
Content last modified: 4 November 2019