The Scenarios
Note: This data set has now been superseded by a new data set on the effects of climate change on global food production under SRES emissions and socio-economic scenarios produced by the same authors. Users are recommended to use the new data instead. SEDAC is maintaining this web site for reference purposes.
1. The Climate Change Scenarios
Scenarios of future climate were derived from the output of general circulation
models (GCMs) driven by anticipated changes in atmospheric composition
(e.g., CO2 emissions, sulphate aerosols,
etc). GCMs are mathematical models that describe the processes
that are known to occur in the earth's climate system and their possible
interactions. Such models are used to forecast the trend of climate over
the coming decades. Their results are still tentative and should not be
accepted uncritically. However, we should examine the implications of
their predictions, while continuing to look for the emerging empirical
evidence of changing climate. A list of the major GCMs is available at
the IPCC
web site.
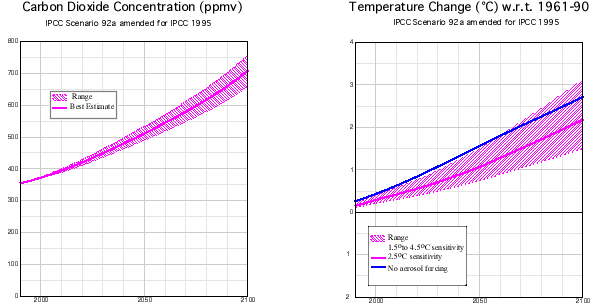
Examples of IPCC Carbon-Dioxide Concentrations Scenarios and Associated Temperature Changes

Source: Intergovernmental Panel on Climate Change (1995)
Two kinds of climate change scenarios were utilized: equilibrium scenarios and transient scenarios. The former are based on the assumption of a doubling of atmospheric CO2 concentrations from pre-industrial levels (i.e., from 227 ppm to 555 ppm). When that will happen no one can be sure, so equilibrium scenarios are not tied to specific future dates, but rather simply reflect the point at which CO2 is doubled in the atmosphere. The equilibrium scenarios for three major GCMs were utilized in this study: The Goddard Institute for Space Studies (GISS), the Geophysical Fluid Dynamics Laboratory (GFDL), and the UK Meteorological Office (UKMO).
Transient scenarios, by contrast, are time dependent. They tell you what will happen at some date in the future based on assumptions contained within the model. The transient scenarios considered were derived from simulations with the Hadley Centre for Climate Prediction and Research's Climate Model 2 (HadCM2) and Climate Model 3 (HadCM3) of the UK Met Office. The studies analyzed five sets of scenarios derived from the HadCM2 and HadCM3 models with different forcing emmission scenarios.
- HadCM2(97)gg: Ensemble-mean for the HadCM2 model forced with greenhouse gas concentrations from the IS95a emission scenario. [note: this scenario has been removed from the query tool owing to problems with the crop response data (January 2007)]
- HadCM2(97)gs: Same as the one above, but it includes the simulation of the effects of sulphate aerosols, which are expected to attenuate the warming influence of increased CO2 concentrations. [note: this scenario has been removed from the query tool owing to problems with the crop response data (January 2007)]
- HadCM3-A: A variation of the HadCM3 model forced with greenhouse gas concentrations derived form the IS95a emission scenario.
- HadCM2-S550: HadCM2 model forced with a CO2 stabilization scenario (clean scenario). This simulation assumes a major policy effort to reduce greenhouse gas emissions, with stabilization at 550 ppm in 2170.
- HadCM2-S750: HadCM2 model forced with a CO2 stabilization scenario (less clean scenario). This simulation assumes a more modest policy effort to bring about stabilization of CO2 emissions to 750 ppm in 2170.
2. The Agricultural Scenarios
Future agricultural scenarios were the combination of the climate change, crop response scenarios (i.e., physiological response to elevated CO2 ), and farmers' adaptive responses. Thus, the crop simulations were based on some combination of the following assumptions:
Climate change scenarios [8 to choose from]
+
CO2 effects on crop growth [either with
or without] +
Adaptation [none, level 1 and level 2]
For more information on these agricultural scenarios, please see the
Methodology section of this web site.
The following box summarizes all the combinations utilized to generate crop yield estimates. The scenarios have been numbered in order to make them easier to identify.
Scenarios Utilized for the Crop-Climate Modeling
|
Equilibrium Scenarios GISS#1 = Equilibrium scenario, No CO2
effects, No adaptation GFDL#1 = Equilibrium scenario, No CO2
effects, No adaptation UKMO#1 = Equilibrium scenario, No CO2
effects, No adaptation Transient Scenarios [Note: the following set of HadCM2(97)gg scenarios has been removed from the query tool owing to problems with the crop response data (crop yields for CO2 effects scenarios were lower than the no CO2 effects runs - contrary to what is expected)] HadCM2(97)gg#1 = Decade 2020s, CO2
effects (441 ppm), Level 1 adaptation adaptation [Note: the following set of HadCM2(97)gs scenarios has been removed from the query tool owing to problems with the crop response data (crop yields for CO2 effects scenarios were lower than the no CO2 effects runs - contrary to what is expected)] HadCM2(97)gs#1 = Decade 2020s, CO2
effects (441 ppm), Level 1 adaptation adaptation HadCM3-A#1 = Decade 2020s, No CO2
effects, Level 1 adaptation HadCM2-S550#1 = Decade 2020s, No CO2
effects, Level 1 adaptation HadCM2-S750#1 = Decade 2020s, No CO2
effects, Level 1 adaptation |
|
|||||||
| Copyright© 2001. The Trustees of Columbia University in the City of New York. | |||||||


