NASA Website Socioeconomic Data and Applications Center (sedac)
A Data Center in NASA's Earth Observing System Data and Information System (EOSDIS) — Hosted by CIESIN at Columbia University
Data
  • Data Sets
  • Maps
  • Web Pages
  • home
  • Data
    • · Data Sets
    • · Data Collections
    • · Featured Data Uses
    • · Data Citations
    • · Citations Database
    • · Data Submission
  • Maps
    • · Map Gallery
    • · Map Viewer
    • · Map Services
    • · Mapping Tools
  • Themes
    • · Agriculture
    • · Climate
    • · Conservation
    • · Governance
    • · Hazards
    • · Health
    • · Infrastructure
    • · Land Use
    • · Marine and Coastal
    • · Population
    • · Poverty
    • · Remote Sensing
    • · Sustainability
    • · Urban
    • · Water
  • Resources
    • · Guides
    • · Multimedia
    • · Networks
    • · News
    • · Publications
    • · Related Sites
    • · Remote Sensing
    • · Tools
  • Social Media
    • · Twitter
    • · FaceBook
    • · YouTube
    • · Flickr
    • · Blog Posts
    • · Communities
  • About
    • · About SEDAC
    • · User Working Group
    • · Privacy
    • · User Registration
  • Help
 

Global Agricultural Lands

Follow Us: Twitter Follow Us on Facebook YouTube Flickr   |   Share: Twitter Facebook
  • Collection Overview
  • Methods
  • Data Sets (2)
  • Map Gallery (14)
  • Map Services (2)
  • Citations

Methods

A detailed description of the methods utilized to produce the data, as well as research results, are provided in Ramankutty et al. The data sets were developed from a combination of agricultural inventory data and satellite-derived land cover data sets. MODIS land cover data and SPOT Vegetation’s global land cover 2000 (GLC 2000) data were combined to create 391 composite land cover classes. The composite land cover classes were calibrated against the agricultural inventory data by first computing land area fractions from inventory data and then applying linear models relating satellite data sets to agricultural inventory data to compute adjusted cropland and pasture area estimates. Cropland and pasture area estimates from land cover data sets were aggregated to the subnational administrative level and then compared with the inventory data to determine correction factors.

global map of cropland 
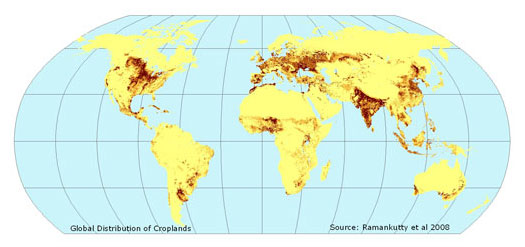
Figure 1. Global Distribution of Croplands in 2000

global map of pasture lands 
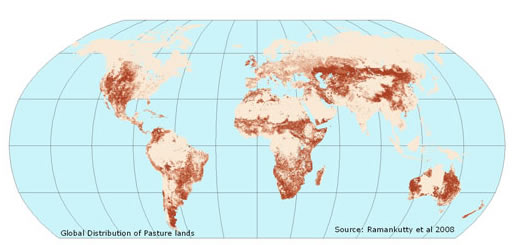
Figure 2. Global Distribution of Pasture Lands in 2000

Home | Data | Data Uses | Data Citations | Maps | Map Services

News | Tools | Guides | Publications | Blog Posts

About | Help | Privacy | User Registration

Copyright © 1997–2023. The Trustees of Columbia University in the City of New York.

WDS ICSU