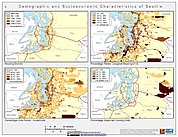
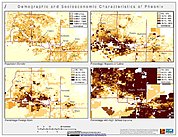
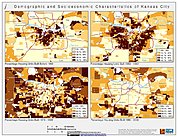
Population Distribution and Change
Follow Us: Twitter Follow Us on Facebook YouTube Flickr | Share: Twitter FacebookData Sets (2 of 98) View All
Administrative Unit Center Points with Population Estimates, v4.11 (2000, 2005, 2010, 2015, 2020)Gridded Population of the World (GPW), v4To provide a vector (point) version of the input administrative units used in GPWv4 with population estimates, densities, 2010 basic demographic characteristics, and administrative name, area, and data context for use in data integration. |
Basic Demographic Characteristics, v4.11 (2010)Gridded Population of the World (GPW), v4To provide estimates of population counts by age and sex for the year 2010, consistent with national censuses and population registers, as raster data to facilitate data integration. |
Map Gallery (4 of 1352) View All
Featured Data Uses (2 of 27) View All
World Resources Report: Decision Making in a Changing ClimateWorld Resources Institute The widely distributed 2010-2011 World Resources Report: Decision Making in a Changing Climate includes coastal population estimates from SEDAC′s Population Landscape and Climate Estimates (PLACE) data collection. The data includes both the percentage of and a country′s actual population living within 10 kilometers of a coastline, and is based on SEDAC′s Global Rural-Urban Mapping Project (GRUMP) population data set. |
Water Balance of Global Aquifers Revealed by Groundwater FootprintNature Researchers interested in the sustainability of groundwater depletion used SEDAC’s Gridded Population of the World (GPW v3) population count data for 2000 to find that approximately 1.7 billion people inhabit areas impacted by groundwater stress. More than half the people affected live in China and India. |


