NASA Website Socioeconomic Data and Applications Center (sedac)
A Data Center in NASA's Earth Observing System Data and Information System (EOSDIS) — Hosted by CIESIN at Columbia University
Data
  • Data Sets
  • Maps
  • Web Pages
  • home
  • Data
    • · Data Sets
    • · Data Collections
    • · Featured Data Uses
    • · Data Citations
    • · Citations Database
    • · Data Submission
  • Maps
    • · Map Gallery
    • · Map Viewer
    • · Map Services
    • · Mapping Tools
  • Themes
    • · Agriculture
    • · Climate
    • · Conservation
    • · Governance
    • · Hazards
    • · Health
    • · Infrastructure
    • · Land Use
    • · Marine and Coastal
    • · Population
    • · Poverty
    • · Remote Sensing
    • · Sustainability
    • · Urban
    • · Water
  • Resources
    • · Guides
    • · Multimedia
    • · Networks
    • · News
    • · Publications
    • · Related Sites
    • · Remote Sensing
    • · Tools
  • Social Media
    • · Twitter
    • · FaceBook
    • · YouTube
    • · Flickr
    • · Blog Posts
    • · Communities
  • About
    • · About SEDAC
    • · User Working Group
    • · Privacy
    • · User Registration
  • Help
 

Featured Uses of Data

Follow Us: Twitter Follow Us on Facebook YouTube Flickr   |   Share: Twitter Facebook

SEDAC data and information products and services are designed to help users integrate and apply socioeconomic and Earth science data in their research, educational activities, analysis, and decision making. Here are selected examples of uses of SEDAC data.

Fine Particulate Air Pollution and Diabetes

The Lancet Planetary Health – July 13, 2018

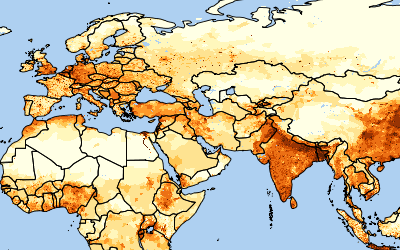
Researchers used observations of very small particulates in the air, as monitored by the U.S. Environmental Protection Agency as well as via the satellite-based Global Annual PM2.5 Grids from MODIS, MISR and SeaWiFS Aerosol Optical Depth (AOD), v1 data set distributed by SEDAC, to uncover the relationship between air pollution and type 2 diabetes. Controlling for non-pollution factors like obesity, they found that tiny particulates are responsible for a significant number of diabetes cases and that reducing exposure to the pollution would yield significant health benefits.

Closed Season

Sensing Our Planet – July 3, 2018
Algae in a groundwater-fed lagoon

Using data from the NASA Gravity Recovery and Climate Experiment (GRACE) satellite instrument and the Advanced Land Observing Satellite Phased Array type L-Band Synthetic Aperture Radar (ALOS PALSAR) to study land subsidence, and SEDAC’s Gridded Population of the World (GPW), v3 to examine the distribution of people, investigators assessed the loss of groundwater storage in one of Mexico's most important watersheds.

Population and Energy Elasticity of Tornado Casualties

Geophysical Research Letters – May 25, 2017

Tornadoes account for about one in five natural hazard-related deaths in the United States.  This recent study investigated the relationships between tornado casualties (injuries and deaths), storm energy, and population using the NASA SEDAC Gridded Population of the World (GPW) v4 data set.  For all tornadoes, investigators found that a doubling of population increased the casualty rate by 21% while a doubling of storm energy increased the casualty rate by 33%.  For the strongest storms casualty rates from increases in population and storm energy were even greater.  These estimates can be used to project future changes in casualties given known population and storm trends.

Mapping Sub-Saharan Agroecological and Socioeconomic Trends

HarvestChoice Mappr – May 1, 2017

SEDAC's Global Rural-Urban Mapping Project (GRUMP) v1 population and urban extent data are used in the International Food Policy Research Institute (IFPRI) interactive mapping application for Sub-Saharan Africa.  The application, known as Mappr, is built on IFPRI’s HarvestChoice geospatial database of biophysical and socioeconomic indicators covering four broad research domains: agriculture, agroecology, demographics and markets.  Mappr serves as the core to a decision-support system enabling people to visualize relationships between major agroecological challenges, like soil and land degradation, and socioeconomic trends such as poverty, health and nutrition.

Transboundary River Basins: Status and Trends

United Nations Environment Programme – April 14, 2016
Victoria Falls River Basin

For a new report assessing the environmental and socioeconomic conditions in 286 of the world’s transboundary river basins, SEDAC data were used in the calculation of several indicators: economic dependence on water resources, societal wellbeing levels, and the risk of climate-related hazards. The report is an outcome of the Transboundary Waters Assessment Programme, coordinated by the UNEP-DHI (Danish Hydrological Institute) Center on Waste and Environment in execution with international partners, for the Global Environmental Facility, with the aim of creating a baseline assessment of all transboundary water resources on Earth.

Changing Global Patterns of Urban Exposure to Flood and Drought Hazards

Global Environmental Change – January 15, 2016
Changing Global Patterns of Urban Exposure to Flood and Drought Hazards

Combining SEDAC’s Low Elevation Coastal Zone (LECZ) data and Natural Disaster Hotspots flood frequency maps with land cover imagery derived from NASA’s MODIS instrument, the researchers who developed SEDAC’s Global Grid of Probabilities of Urban Expansion data set ask how the global and regional patterns of urban growth in the near future will affect urban susceptibility to floods and droughts.  What they found is that the extent of urban areas exposed to floods and drought will generally double by 2030, even without factoring in the potential impacts of climate change.

Visualizing the Global Extent of Cropland and Pastures

Food: An Atlas – June 11, 2014
Visualizing the Global Extent of Cropland and Pastures

The SEDAC Global Agricultural Cropland and Pasture data sets are presented in Food: An Atlas, which uses maps to explore global food distribution and production.  The cropland and pasture data, originally developed by Ramankutty et al (2008), are transformed into cartograms, in which the land area of countries is replaced by extent of crops and pastures, by Benjamin Hennig to better visualize the magnitude of agricultural areas around the world.

Relationships Between Population Density and Burned Areas Around the Globe

PLoS ONE – February 7, 2014
Relationships Between Population Density and Burned Areas Around the Globe

A complex spatial relationship between population density and fire exists across the globe.  This study looked at this relationship by comparing population density data from SEDAC’s Gridded Population of the World to burned area maps based largely on NASA MODIS satellite observations.  In general it finds that in regions where climate or vegetation create conditions where fire is likely, people tend to suppress the fire, whereas in less fire-prone regions people tend to let the fire spread.  In most regions of the world, increased population density initially leads to an increase in burned area but that relationship reverses at higher levels of population density.

Using Satellites to Better Understand Carbon Dioxide Emissions

Geophysical Research Letters – January 31, 2014
Using Satellites to Better Understand Carbon Dioxide Emissions

Carbon dioxide (CO2) is the primary greenhouse gas responsible for warming the planet.  While the global distribution of carbon dioxide in the atmosphere is well known, tracking the emissions of CO2 to their sources is a challenge, especially over large urban areas.  One approach uses the NASA instrument Measurement of Pollution in the Troposphere (MOPITT). Here scientists explore how carbon monoxide (CO) emission measurements from MOPITT can complement existing satellite CO2 measurements in megacities delineated by SEDAC’s Gridded Population of the World, to provide improved spatial and temporal understanding of CO2 emissions.

Human Impacts Drive Global Tree Cover Patterns

Nature Communications – January 7, 2014
Human Impacts Drive Global Tree Cover Patterns

Human impacts have resulted in a global tendency for tree cover to be constrained to sloped terrain and losses to be concentrated on flat terrain. This effect, which the researchers quantify using NASA’s Moderate Resolution Imaging Spectroradiometer (MODIS) and Shuttle Radar Topography Mission (SRTM) satellite instruments, increases in strength with increasing human pressure, as measured by SEDAC’s Human Influence Index data set. It is most pronounced in countries with rapidly growing economies, limited human population stress, and highly effective governments, as defined in SEDAC’s Environmental Sustainability Index. By combining these measures of human influence with the remote sensing of trees, the researchers show how interactions between local topographic conditions and human impacts control tree cover distribution.

Fire Activity and Net Primary Productivity

Global Ecology and Biogeography – August 29, 2013
Forest Fire

In moist regions around the globe, fire activity is believed to be driven by drought frequency, whereas in dry regions, fire is thought to be limited by the amount of fuel available.  Researchers recently tested these ideas by comparing global fire activity as detected by the NASA Moderate Resolution Imaging Spectroradiometer (MODIS) sensor with measures of vegetation such as net primary productivity from the Human Appropriation of Net Primary Productivity (HANPP) data collection available from SEDAC and the Normalized Difference Vegetation Index (NDVI) derived from NOAA satellite data.  Although fire activity is indeed limited by droughts in moist areas and by fuel in dry regions, human activities—specifically tropical rain forest deforestation and fire suppression policies in the western U.S.—also strongly influence fire activity.

Decline of Forest Elephants in Central Africa

PLoS ONE – June 21, 2013
Elephnat Declines

A recent survey of African forest elephants has revealed a startling reduction in that animal's population and geographic range over the past decade.  Human population density, as measured by SEDAC's Gridded Population of the World (GPW v3) data set, and nearness to human infrastructure, as indicated by SEDAC's Human Influence Index (HII v2), are two of the strongest predictors of that decline along with hunting intensity, poor governance and absence of law enforcement.

Global Forecasts of Urban Expansion to 2030

Proceedings of the National Academy of Sciences – February 23, 2013
Phoenix Sprawl

The growth of urban areas has long been considered a local issue, but scientists using SEDAC’s Global Rural-Urban Mapping Project (GRUMP v1) and NASA’s Moderate Resolution Imaging Spectroradiometer (MODIS) land cover product have made spatially explicit forecasts of urban land-cover change to show that biodiversity hotspots and carbon pools will be significantly affected by urban population growth.  The researchers estimate that by 2030, urban land area around the globe will nearly triple the level in year 2000, resulting in substantial loss of habitats in key biodiversity hotspots.

Sea Level Rise Impacts on Wetlands

Ramsar Scientific and Technical Briefing Notes – December 15, 2012
Seal Level Rise Wetlands

An analysis of coastal wetlands loss from sea level rise due to climate change, conducted by SEDAC for the Ramsar Convention's Scientific and Technical Review Panel, provides estimates of wetland losses as a basis for identifying potential adaptation measures. The Ramsar Wetlands of International Importance: Sea Level Rise Impacts data and related map client make use of NASA’s Shuttle Radar Topography Mission (SRTM) elevation data, SEDAC’s Global Rural-Urban Mapping Project version 1 (GRUMPv1) population density grid for the year 2000 (and a 2010 projection), the GRUMPv1 urban extents grid, and an updated version of SEDAC’s Global Subnational Infant Mortality Rates, v1 data.

Prosperity Shining

Sensing Our Planet – October 13, 2012
Night time Lights India

This article in the annual anthology, Sensing Our Planet: NASA Earth Science Research Features 2012, describes how economists have used night-time lights satellite data together with SEDAC human settlements data as a measure of economic growth, complementing traditional economic data. The researchers combined a dataset produced by NOAA’s National Geophysical Data Center from the Defense Meteorological Satellite Program (DMSP) with SEDAC’s Global Rural-Urban Mapping Project version 1 (GRUMPv1) Settlement Points to attribute economic activity to specific cities.  The researchers, including former SEDAC staff member Adam Storeygard, show that the night-time lights data enable cross-border and subnational assessments of economic activity.

Water Balance of Global Aquifers Revealed by Groundwater Footprint

Nature – September 8, 2012
Aquifer

Researchers interested in the sustainability of groundwater depletion used SEDAC’s Gridded Population of the World (GPW v3) population count data for 2000 to find that approximately 1.7 billion people inhabit areas impacted by groundwater stress.  More than half the people affected live in China and India.

Beyond Seven Billion

Los Angeles Times – July 23, 2012
A five-part article examines the implications of world population growth beyond seven billion; SEDAC's Human Footprint data shows where Earth been most impacted.Beyond 7 Billion feature image showing chinese people crowded on an escalator

A five-part article examines the implications of world population growth beyond seven billion; SEDAC's Human Footprint data shows where Earth been most impacted.

Another Way to Look at an Air Quality Problem

State of the Planet – March 7, 2012
Satellite image of a particularly valuable perspective on PM2

Satellite data offer a particularly valuable perspective on PM2—small particles deriving mostly from burning fossil fuels and biomass, which can harm human health—because ground instruments may be unavailable or offer limited information, as is the case in China. With that in mind, researchers at Columbia University’s Earth Institute and Batelle Memorial Institute have developed maps based on satellite data that depict annual PM2.5 exposure in all of China’s provinces.

World Resources Report: Decision Making in a Changing Climate

World Resources Institute – November 18, 2011
Bangkok, Thailand - November 4, 2011: Man with his family and dogs overlooking flooded street of Bangkok. Unusual heavy rains in July 2011 combined with high tides of the sea triggered massive flooding in Thailand. Approximately one third of all provinces are affected.

The widely distributed 2010-2011 World Resources Report: Decision Making in a Changing Climate includes coastal population estimates from SEDAC′s Population Landscape and Climate Estimates (PLACE) data collection. The data includes both the percentage of and a country′s actual population living within 10 kilometers of a coastline, and is based on SEDAC′s Global Rural-Urban Mapping Project (GRUMP) population data set.

We are Seven Billion

Nature Climate Change – October 3, 2011
image of a crowd of people

A Nature Climate Change article focuses on the milestone of world population passing the seven billion mark and the implications for climate change mitigation and adaptation. Maps featuring SEDAC’s GRUMP data set, describing populations at risk of climate change impacts, are featured on Page 3. The article also features interviews with former SEDAC project scientist Deborah Balk and SEDAC deputy manager Alex de Sherbinin. 

Gridded Population of the World Version 3

National Geographic – May 19, 2011
A map of the Gridded Population of the World Version 3

A map using SEDAC′s Gridded Population of the World data set to illustrate a discussion of population density and population growth, page 50 of the National Geographic Visual Atlas of the World (2009).

Africa Human Footprint Map

National Geographic – May 19, 2011
National Geographic Africa Human Footprint

A map of SEDAC′s the Human Footprint illustrates the extent to which Africa′s land area is influenced by humans.

USDA Food Desert Locator

U.S. Department of Agriculture – May 7, 2011
USDA Food Desert Locator

This interactive map tool and associated data set lets users map low-income areas having high-density populations that lack good access to nutritious food (“food deserts”). Census tract-level statistics for these areas may also be viewed. Satellite imagery provides an optional background in the map viewer. SEDAC’s U.S. Census Grids data are used as a key source for the tool.

China: Distribution of Chickens, Ducks, and Geese

Agriculture, Ecosystems, and Environment – April 30, 2011
Modelling the Distribution of Chickens, Ducks, and Geese in China

SEDAC′s GPWv3 and GRUMPv1, along with MODIS and SRTM data, are used in a paper, “Modelling the Distribution of Chickens, Ducks, and Geese in China,” by D.J. Prosser et al, appearing in Agriculture, Ecosystems & Environment. Global concerns over the emergence of zoonotic pandemics emphasize the need for high-resolution population distribution mapping and spatial modelling. Because of a lack of livestock population distribution data in China, modeling the distribution of poultry is critical to studying emerging zoonotic pandemics. GRUMP population density and urban extents are predictor variables in the model in this paper.

Populations in Proximity to Nuclear Power Plants

Nature News – April 21, 2011
Proximity to nuclear power plants, featured on Nature News web site

An embedded Google Earth client in an article in Nature News shows the population count living within 75 kilometers of each of the world′s nuclear power plants. Population increases with circle size and color, from green (< 0.5 million) to red (> 20 million). The data and analysis were developed by SEDAC.

Where the Hungry People Are

Nature News – July 28, 2010
Where the Hungry People Are

A map by SEDAC of the world′s malnourished illustrates an article in Nature News, “Food: The Growing Problem.” It makes the case that inability to purchase food rather than lack of enough is the reason for worldwide malnutrition. 

Managing Urban Growth and Flood Risk in a Changing Climate/South and Southeast Asia

World Development Report 2010 – March 16, 2010
map of Port Phillip Bay

The SEDAC data set Low-elevation Coastal Zone (LECZ) is the basis for a set of national-level indicators of the total area and population in the LECZ circa 2000. Map 2.2 (page 94), Chapter 2 of the World Development Report 2010, Managing Urban Growth and Flood Risk in a Changing Climate in South and Southeast Asia.  

Disaster Awaits Cities in Earthquake Zones

The New York Times – February 24, 2010
Disaster Awaits Cities in Earthquake Zones

Data and maps compiled by SEDAC and the Center for Hazards and Risk Research are featured in a front-page news article in the New York Times (print version February 25) assessing the vulnerability of buildings in earthquake zones. “Where Shoddy Construction Could Mean Death” shows a map (top) that depicts the predicted number of deaths in Instanbul from a magnitude 7.5 earthquake, depending on the type of construction of the building. The second map (bottom) ranks the vulnerability of other urban areas in earthquake zones with more than one million people.

People Reported Missing via IReport

CNN – February 23, 2010
People Reported Missing via IReport

This interactive map shows the population missing as a result of the Haiti earthquake on January 28, 2010. Thousands of personal reports of loved ones missing were provided to Ireport, and this information was combined with SEDAC population data to create the map.

Earthquakes and Aftershocks

CNN – February 23, 2010
Earthquakes and Aftershocks

An interactive map shows impacts from the recent Haiti earthquake.

Caught in the Danger Zone

The Wall Street Journal – January 13, 2010
CIESIN supplied population density data for a map of the Haiti earthquake.

SEDAC population density data was used in a map of the Haiti earthquake.

A Catalog of Change

Sensing Our Planet: NASA Earth Science Research Features 2009 – November 11, 2009
CIESIN’s role in making climate change data freely available to the public is noted in an article in this annual collection of articles about how scientists use Earth science data to learn about the planet.

SEDAC′s role in making climate change data freely available to the public is noted in a collection of articles on how scientists use Earth science data to learn about the planet.

Mapping Population and Geographic Data

The New Security Beat – September 24, 2009
Mapping Population and Geographic Data - Marc Levy

In this blog for the Center Environmental and Security Program (ECSP), CIESIN deputy director Marc Levy talks with ECSP director Geoff Dabelko about using the Gridded Population of the World (GPW) data product to aid in combining population and geographic data.

Geo Quiz

PRI’s The World – June 10, 2009
Geo Quiz

The report on linkages between climate and migration, In Search of Shelter, is featured in a daily geography quiz of the public radio program, PRI’s The World.

Spatial disparities within Urban Settlements

The World Development Report 2009 – March 10, 2009
Map of Spatial disparities within Urban Settlements

A typically higher standard of living in urban areas compared to rural ones does not rule out striking disparities within cities. SEDAC data from its Global Poverty Mapping Project is used as the basis for this  map. Map 1.2, illustration for Chapter 1--Density, The World Development Report Online 2009.

NASA Data Helps Pinpoint Impacted Populations in Disaster Aftermath

Space & Earth science/Earth Sciences – June 13, 2008
NASA Data Helps Pinpoint Impacted Populations in Disaster Aftermath

A map of Burma, based on the SEDAC Gridded Population of the World (GPW) data product, reveals that coastal areas hit hardest by the cyclone in May 2008 were highly populated. (Areas in progressively darker shades of brown represent increased population.)

Taliban Wages War on Police in Its New Front in Pakistan

The Wall Street Journal – May 28, 2008
Taliban Wages War on Police in Its New Front in Pakistan

Map of Pakistan illustrating areas of escalating violence in the Punjab, the country’s most populous province.

Turning Schools from Death Traps into Havens

Science Times section of The New York Times – May 27, 2008
Turning Schools from Death Traps into Havens

Map of school-age children in earthquake zones illustrates an accompanying article: following the recent earthquakes in China, experts assess school safety and the vulnerability of children to earthquakes.

Earthquake Rocks China

WSJ Online – May 13, 2008
Earthquake Rocks China

Map of China illustrates an article comparing the location of the Sichuan province earthquakes with population centers in China.

Map describing the path of Cyclone Nargis through the Irrawaddy Delta and the populations affected

CNN Video Newscast – May 7, 2008
Map of the The Irrawaddy Delta and Cyclone Nargis

A CNN video newscast refers to a map of the path of Cyclone Nargis and the populations affected, in the worst natural disaster in the recorded history of Burma (Myanmar).

Scorecard on the Environment

NASA Earth Data Web Site – December 1, 2007
Scorecard on the Environment

Sensing Our Planet: NASA Earth Science Research Features 2008 features an article on how SEDAC data was used for the 2008 Environmental Performance Index and other environmental assessments; CIESIN’s Marc Levy is interviewed.

Home | Data | Data Uses | Data Citations | Maps | Map Services

News | Tools | Guides | Publications | Blog Posts

About | Help | Privacy | User Registration

Copyright © 1997–2023. The Trustees of Columbia University in the City of New York.

WDS ICSU