NASA Website Socioeconomic Data and Applications Center (sedac)
A Data Center in NASA's Earth Observing System Data and Information System (EOSDIS) — Hosted by CIESIN at Columbia University
Data
  • Data Sets
  • Maps
  • Web Pages
  • home
  • Data
    • · Data Sets
    • · Data Collections
    • · Featured Data Uses
    • · Data Citations
    • · Citations Database
    • · Data Submission
  • Maps
    • · Map Gallery
    • · Map Viewer
    • · Map Services
    • · Mapping Tools
  • Themes
    • · Agriculture
    • · Climate
    • · Conservation
    • · Governance
    • · Hazards
    • · Health
    • · Infrastructure
    • · Land Use
    • · Marine and Coastal
    • · Population
    • · Poverty
    • · Remote Sensing
    • · Sustainability
    • · Urban
    • · Water
  • Resources
    • · Guides
    • · Multimedia
    • · Networks
    • · News
    • · Publications
    • · Related Sites
    • · Remote Sensing
    • · Tools
  • Social Media
    • · Twitter
    • · FaceBook
    • · YouTube
    • · Flickr
    • · Blog Posts
    • · Communities
  • About
    • · About SEDAC
    • · User Working Group
    • · Privacy
    • · User Registration
  • Help
 

Applications of Satellite Remote Sensing

Follow Us: Twitter Follow Us on Facebook YouTube Flickr   |   Share: Twitter Facebook
  • Theme Home
  • Data Sets
  • Map Gallery
  • Map Services
  • Featured Data Uses
  • Resources
    • Guides
    • Multimedia
    • Networks
    • Publications
    • Related Sites
    • Remote Sensing

Data Sets (2 of 51) View All

Ancillary Data, v1 (1998 – 2007)

Indicators of Coastal Water Quality

  • Overview
  • Download

To provide data that can assist in the extraction and analysis of chlorophyll-a concentration and trends from global grids.

Annual Chlorophyll-a Concentration, v1 (1998 – 2007)

Indicators of Coastal Water Quality

  • Overview
  • Download

To provide a gridded version of existing SeaWiFS data in GIS-compatible formats in order to determine concentrations of chlorophyll-a in the coastal water column and to facilitate the integration with other data.

Map Gallery (4 of 242) View All

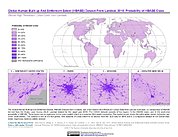
Probability of HBASE Class, 2010

Map: Probability of HBASE Class, 2010
Hi-Resolution: PDF | PNG

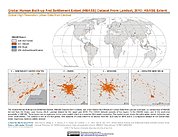
HBASE Extent, 2010

Map: HBASE Extent, 2010
Hi-Resolution: PDF | PNG

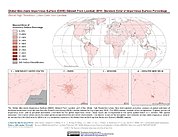
GMIS Standard Error Impervious Surface Percentage, 2010

Map: GMIS Standard Error Impervious Surface Percentage, 2010
Hi-Resolution: PDF | PNG

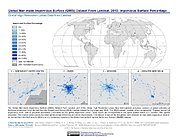
GMIS Impervious Surface Percentage, 2010

Map: GMIS Impervious Surface Percentage, 2010
Hi-Resolution: PDF | PNG

Featured Data Uses (2 of 4) View All

Mapping Population and Geographic Data

The New Security Beat

In this blog for the Center Environmental and Security Program (ECSP), CIESIN deputy director Marc Levy talks with ECSP director Geoff Dabelko about using the Gridded Population of the World (GPW) data product to aid in combining population and geographic data.

Fire Activity and Net Primary Productivity

Global Ecology and Biogeography

In moist regions around the globe, fire activity is believed to be driven by drought frequency, whereas in dry regions, fire is thought to be limited by the amount of fuel available.  Researchers recently tested these ideas by comparing global fire activity as detected by the NASA Moderate Resolution Imaging Spectroradiometer (MODIS) sensor with measures of vegetation such as net primary productivity from the Human Appropriation of Net Primary Productivity (HANPP) data collection available from SEDAC and the Normalized Difference Vegetation Index (NDVI) derived from NOAA satellite data.  Although fire activity is indeed limited by droughts in moist areas and by fuel in dry regions, human activities—specifically tropical rain forest deforestation and fire suppression policies in the western U.S.—also strongly influence fire activity.

Home | Data | Data Uses | Data Citations | Maps | Map Services

News | Tools | Guides | Publications | Blog Posts

About | Help | Privacy | User Registration

Copyright © 1997–2023. The Trustees of Columbia University in the City of New York.

WDS ICSU