NASA Website Socioeconomic Data and Applications Center (sedac)
A Data Center in NASA's Earth Observing System Data and Information System (EOSDIS) — Hosted by CIESIN at Columbia University
Data
  • Data Sets
  • Maps
  • Web Pages
  • home
  • Data
    • · Data Sets
    • · Data Collections
    • · Featured Data Uses
    • · Data Citations
    • · Citations Database
    • · Data Submission
  • Maps
    • · Map Gallery
    • · Map Viewer
    • · Map Services
    • · Mapping Tools
  • Themes
    • · Agriculture
    • · Climate
    • · Conservation
    • · Governance
    • · Hazards
    • · Health
    • · Infrastructure
    • · Land Use
    • · Marine and Coastal
    • · Population
    • · Poverty
    • · Remote Sensing
    • · Sustainability
    • · Urban
    • · Water
  • Resources
    • · Guides
    • · Multimedia
    • · Networks
    • · News
    • · Publications
    • · Related Sites
    • · Remote Sensing
    • · Tools
  • Social Media
    • · Twitter
    • · FaceBook
    • · YouTube
    • · Flickr
    • · Blog Posts
    • · Communities
  • About
    • · About SEDAC
    • · User Working Group
    • · Privacy
    • · User Registration
  • Help
 

Hazards and Disaster Risk

Follow Us: Twitter Follow Us on Facebook YouTube Flickr   |   Share: Twitter Facebook
  • Theme Home
  • Data Sets
  • Map Gallery
  • Map Services
  • Featured Data Uses
  • Resources
    • Guides
    • Multimedia
    • Networks
    • News
    • Related Sites

Data Sets (2 of 54) View All

Food Insecurity Hotspots Data Set, v1 (2009 – 2019)

Food Security

  • Overview
  • Download
  • Documents
  • (2) Maps
  • (12) WMS

To provide gridded data that identify the level of intensity and frequency of food insecurity over the 10 years between 2009 and 2019, as well as hotspot areas that have experienced consecutive food insecurity events, based on FEWS NET Food Security Data.

Geocoded Disasters (GDIS) Dataset, v1 (1960 – 2018)

Natural Disasters

  • Overview
  • Download
  • Documents
  • (1) Maps

To provide the subnational location for different types of natural disasters recorded in EM-DAT between 1960-2018.

Map Gallery (4 of 105) View All

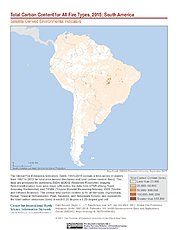
Total Carbon Content All Fire Types (2015): South America

Map: Total Carbon Content All Fire Types (2015): South America
Hi-Resolution: PDF | PNG

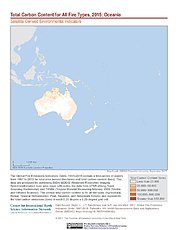
Total Carbon Content All Fire Types (2015): Oceania

Map: Total Carbon Content All Fire Types (2015): Oceania
Hi-Resolution: PDF | PNG

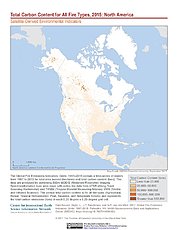
Total Carbon Content All Fire Types (2015): North America

Map: Total Carbon Content All Fire Types (2015): North America
Hi-Resolution: PDF | PNG

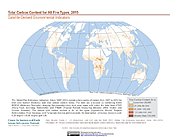
Total Carbon Content All Fire Types (2015)

Map: Total Carbon Content All Fire Types (2015)
Hi-Resolution: PDF | PNG

Featured Data Uses (2 of 11) View All

Changing Global Patterns of Urban Exposure to Flood and Drought Hazards

Global Environmental Change

Combining SEDAC’s Low Elevation Coastal Zone (LECZ) data and Natural Disaster Hotspots flood frequency maps with land cover imagery derived from NASA’s MODIS instrument, the researchers who developed SEDAC’s Global Grid of Probabilities of Urban Expansion data set ask how the global and regional patterns of urban growth in the near future will affect urban susceptibility to floods and droughts.  What they found is that the extent of urban areas exposed to floods and drought will generally double by 2030, even without factoring in the potential impacts of climate change.

Turning Schools from Death Traps into Havens

Science Times section of The New York Times

Map of school-age children in earthquake zones illustrates an accompanying article: following the recent earthquakes in China, experts assess school safety and the vulnerability of children to earthquakes.

Home | Data | Data Uses | Data Citations | Maps | Map Services

News | Tools | Guides | Publications | Blog Posts

About | Help | Privacy | User Registration

Copyright © 1997–2023. The Trustees of Columbia University in the City of New York.

WDS ICSU