Human Appropriation of Net Primary Productivity (HANPP)
Follow Us: Twitter Follow Us on Facebook YouTube Flickr | Share: Twitter FacebookIntroduction
In a June 2004 issue of the journal Nature a team of researchers from the NASA Goddard Space Flight Center, the University of Maryland, the World Wildlife Fund, Stanford University, the National Center for Atmospheric Research and Bowie State University published an analysis of global patterns in human consumption of net primary productivity (NPP). NPP—the net amount of solar energy converted to plant organic matter through photosynthesis—can be measured in units of elemental carbon and represents the primary food energy source for the world's ecosystems. Human appropriation of net primary productivity (HANPP), through the consumption of food, paper, wood and fiber, alters the composition of the atmosphere, levels of biodiversity, energy flows within food webs and the provision of important ecosystem services. A more detailed paper presenting similar results was published by the NASA lead researchers (Imhoff and Bounoua) in a November 2006 article in the Journal of Geophysical Research(see citation section below).
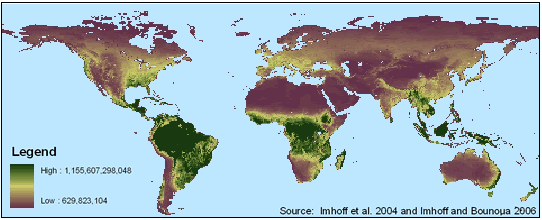
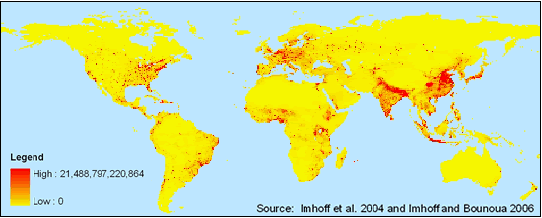
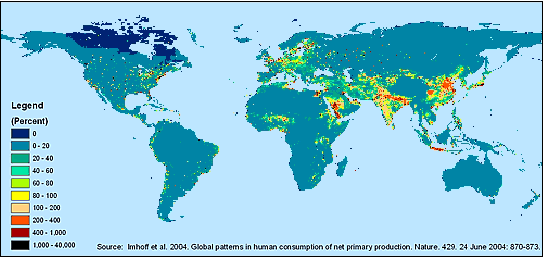
This Web site provides access to the spatial data sets utilized in the Nature and JGR articles: the original satellite-derived quarter-degree NPP grid (Figure 1); the intermediate model of human appropriation of NPP (low and high variants of HANPP were also produced but are not distributed here) (Figure 2); and the HANPP as a percent of NPP (Figure 3). The data are available in raster GRID and Compressed GeoTIFF formats. In addition, a downloadable Excel format file provides tabular data by country on total estimated consumption of NPP in the form of food, paper, wood, and fiber.
A popular article based on these research results is available from the NASA Earth Observatory Web site, and is entitled "Can Earth's Plants Keep Up With Us?" (Sept. 2007).
Figure 1. Spatial Distribution of Net Primary Productivity (NPP) (in grams of carbon)
Figure 2. Human Appropriation of Net Primary Productivity (HANPP) (in grams of carbon)
Figure 3. HANPP as a Percentage of Local NPP