NASA Website Socioeconomic Data and Applications Center (sedac)
A Data Center in NASA's Earth Observing System Data and Information System (EOSDIS) — Hosted by CIESIN at Columbia University
Data
  • Data Sets
  • Maps
  • Web Pages
  • home
  • Data
    • · Data Sets
    • · Data Collections
    • · Featured Data Uses
    • · Data Citations
    • · Citations Database
    • · Data Submission
  • Maps
    • · Map Gallery
    • · Map Viewer
    • · Map Services
    • · Mapping Tools
  • Themes
    • · Agriculture
    • · Climate
    • · Conservation
    • · Governance
    • · Hazards
    • · Health
    • · Infrastructure
    • · Land Use
    • · Marine and Coastal
    • · Population
    • · Poverty
    • · Remote Sensing
    • · Sustainability
    • · Urban
    • · Water
  • Resources
    • · Guides
    • · Multimedia
    • · Networks
    • · News
    • · Publications
    • · Related Sites
    • · Remote Sensing
    • · Tools
  • Social Media
    • · Twitter
    • · FaceBook
    • · YouTube
    • · Flickr
    • · Blog Posts
    • · Communities
  • About
    • · About SEDAC
    • · User Working Group
    • · Privacy
    • · User Registration
  • Help
 

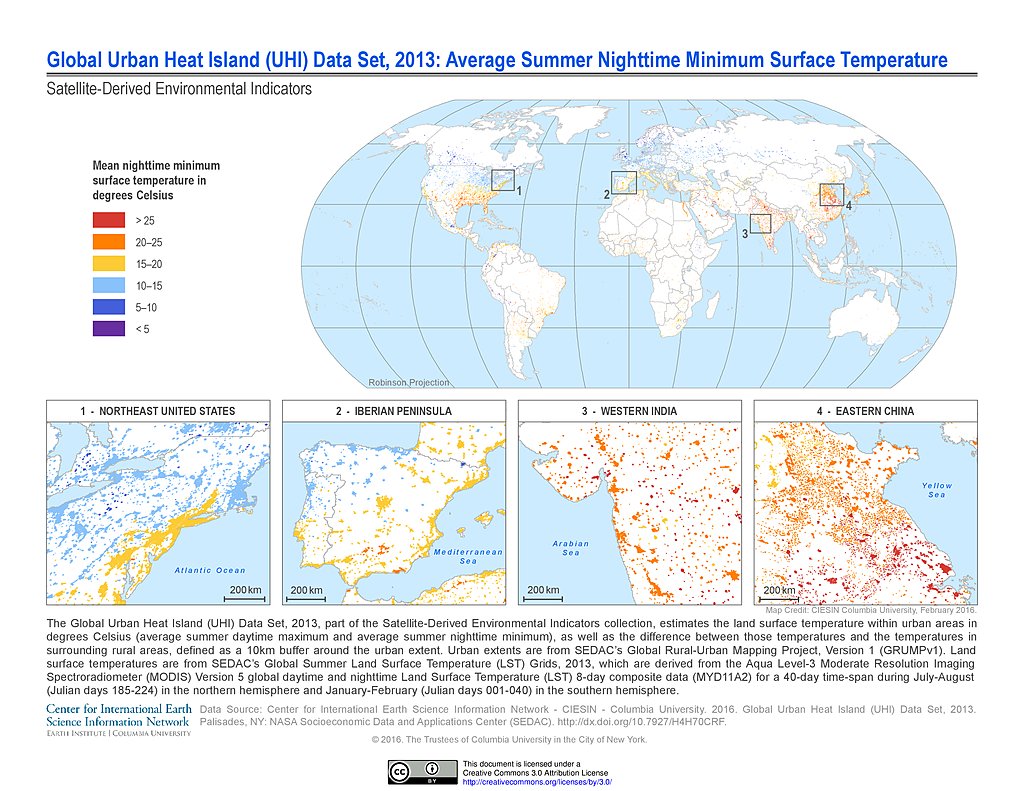
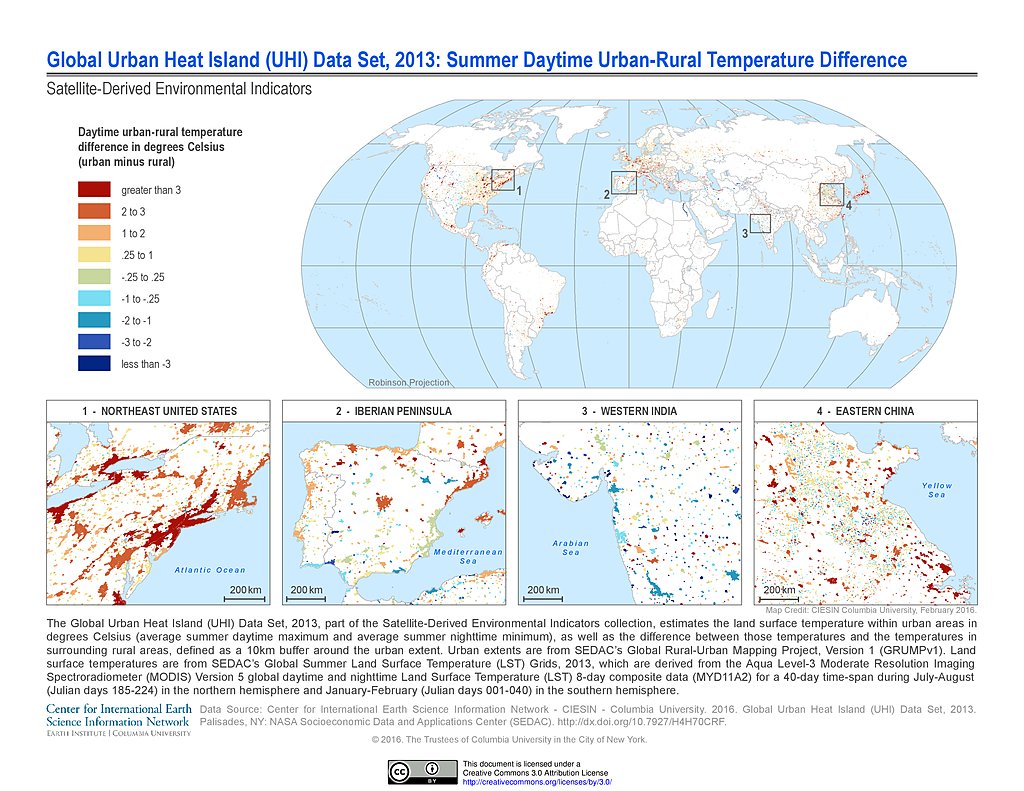
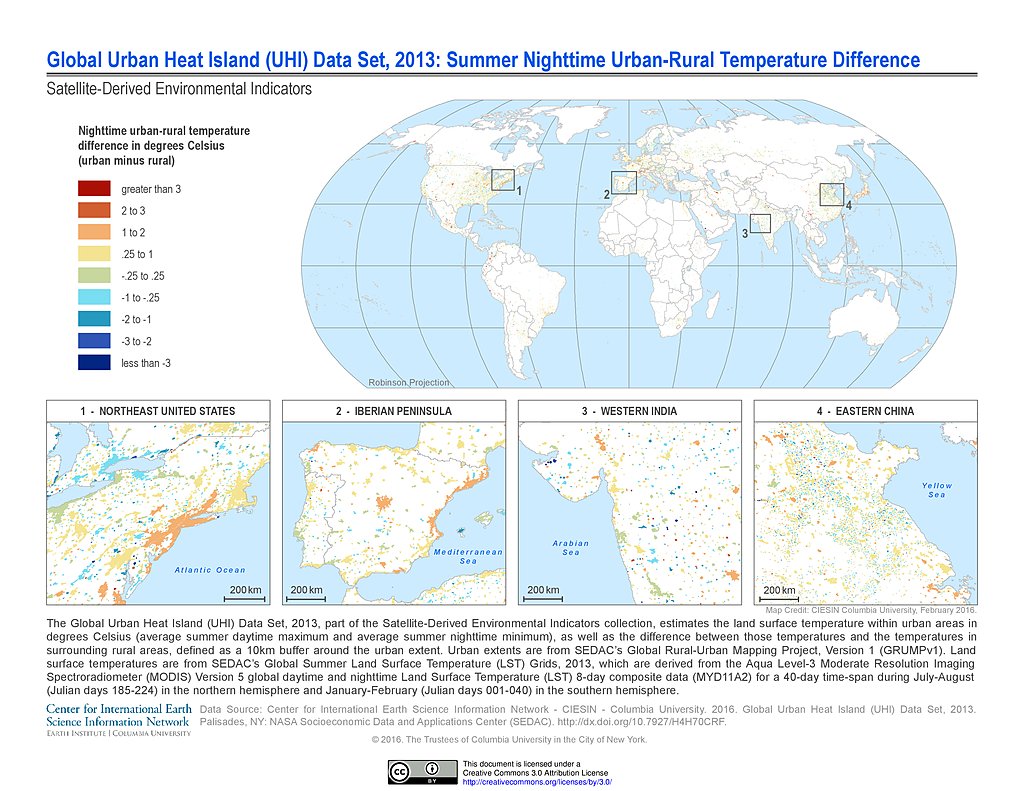
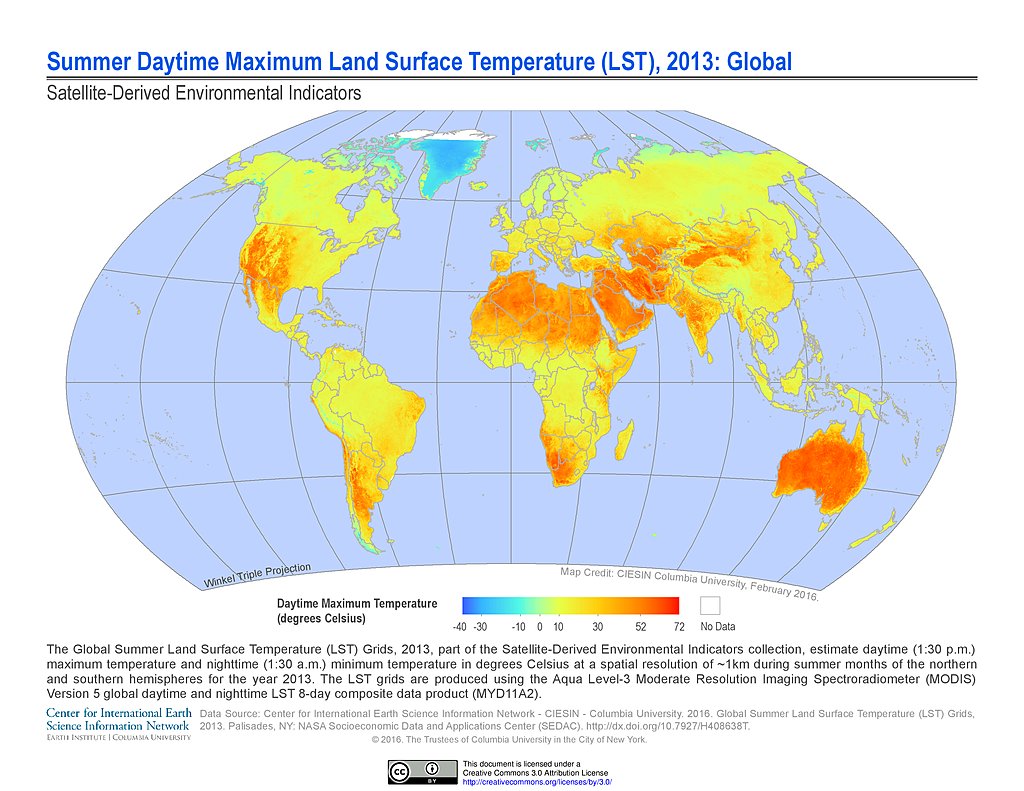
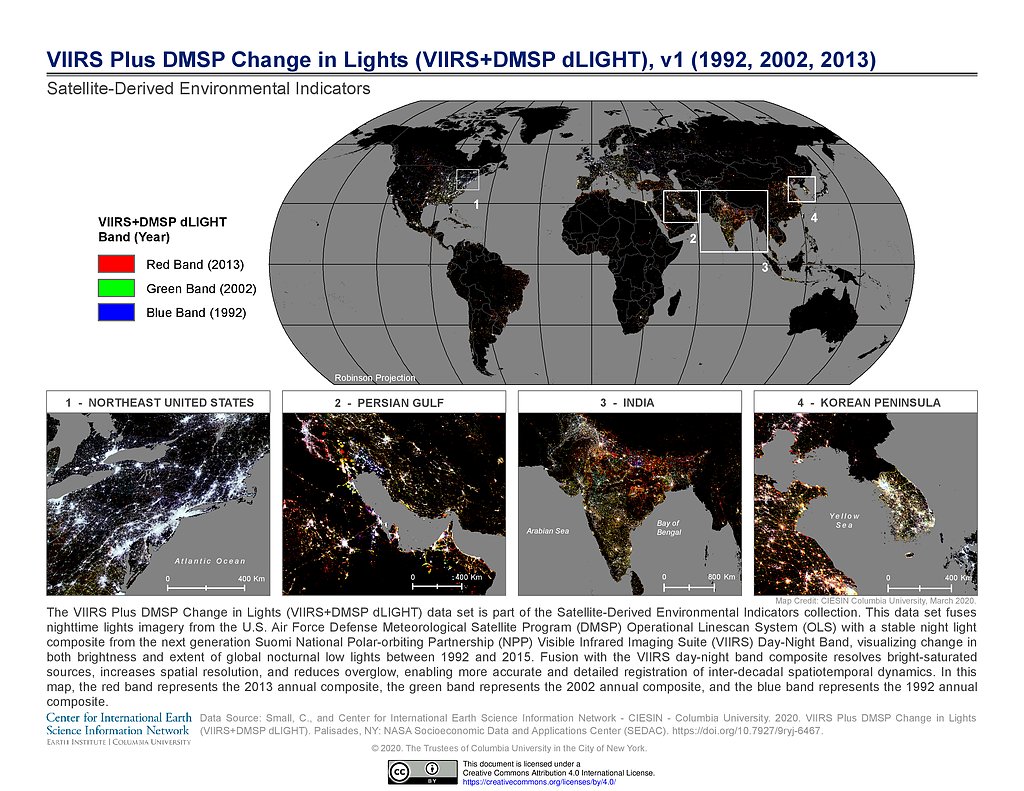
Satellite-Derived Environmental Indicators

Follow Us: Twitter Follow Us on Facebook YouTube Flickr   |   Share: Twitter Facebook
  • Collection Overview
  • Data Sets (10)
  • Map Gallery (65)
    Search
    Theme
    Agriculture (1)
    Climate (7)
    Hazards (8)
    Health (15)
    Infrastructure (6)
    Land Use (8)
    Remote Sensing (17)
    Sustainability (16)
    Urban (14)
    Water (1)
  • Map Services (14)
  • Citations
Data Sets » Region: GlobalRemove Facet
1 of 1
Prev | Next

NO2 Grids (1996-1998)

Map: NO2 Grids (1996-1998)
Hi-Resolution: PDF | PNG

NO2 Grids (2010-2012)

Map: NO2 Grids (2010-2012)
Hi-Resolution: PDF | PNG

PM 2.5 Grids V4.GL.03 (1998-2019): % Change

Map: PM 2.5 Grids V4.GL.03 (1998-2019): % Change
Hi-Resolution: PDF | PNG

PM 2.5 Grids V4.GL.03 (1998-2019): Trend Avg Change

Map: PM 2.5 Grids V4.GL.03 (1998-2019): Trend Avg Change
Hi-Resolution: PDF | PNG

PM 2.5 Grids V4.GL.03 (2008)

Map: PM 2.5 Grids V4.GL.03 (2008)
Hi-Resolution: PDF | PNG

PM 2.5 Grids V4.GL.03 (2019)

Map: PM 2.5 Grids V4.GL.03 (2019)
Hi-Resolution: PDF | PNG

PM 2.5 Grids V4.GL.03 (1998)

Map: PM 2.5 Grids V4.GL.03 (1998)
Hi-Resolution: PDF | PNG

UHI Average Summer Daytime Maximum Surface Temperature (2013)

Map: UHI Average Summer Daytime Maximum Surface Temperature (2013)
Hi-Resolution: PDF | PNG

UHI Average Summer Nighttime Minimum Surface Temperature (2013)

Map: UHI Average Summer Nighttime Minimum Surface Temperature (2013)
Hi-Resolution: PDF | PNG

UHI Summer Daytime Urban-Rural Temperature Difference (2013)

Map: UHI Summer Daytime Urban-Rural Temperature Difference (2013)
Hi-Resolution: PDF | PNG

UHI Summer Nighttime Urban-Rural Temperature Difference (2013)

Map: UHI Summer Nighttime Urban-Rural Temperature Difference (2013)
Hi-Resolution: PDF | PNG

Summer Daytime Maximum LST (2013)

Map: Summer Daytime Maximum LST (2013)
Hi-Resolution: PDF | PNG

Summer Nighttime Minimum LST (2013)

Map: Summer Nighttime Minimum LST (2013)
Hi-Resolution: PDF | PNG

Total Area Burned All Fire Types (2015)

Map: Total Area Burned All Fire Types (2015)
Hi-Resolution: PDF | PNG

Total Carbon Content All Fire Types (2015)

Map: Total Carbon Content All Fire Types (2015)
Hi-Resolution: PDF | PNG

GRACE Freshwater Availability Trends (2002-2016)

Map: GRACE Freshwater Availability Trends (2002-2016)
Hi-Resolution: PDF | PNG

VIIRS Plus DMSP Change in Lights (1992, 2002, 2013)

Map: VIIRS Plus DMSP Change in Lights (1992, 2002, 2013)
Hi-Resolution: PDF | PNG
Data Sets » Region: GlobalRemove Facet
1 of 1
Prev | Next

Home | Data | Data Uses | Data Citations | Maps | Map Services

News | Tools | Guides | Publications | Blog Posts

About | Help | Privacy | User Registration

Copyright © 1997–2023. The Trustees of Columbia University in the City of New York.

WDS ICSU