Natural Resource Management Index (NRMI)
Natural Resource Protection and Child Health Indicators, 2015 Release (2010 – 2014 )
General Methods
All indicators are computed as a standardized proximity-to-target ranging from 0 (worst performance) to 100 (at target or best performance).
Natural Resource Protection Indicator
Here we present the method for developing the proximity-to-target scores for the NRPI derived from processing spatial data on protected areas, biomes, and country boundaries. Additional details on the spatial data processing are included at the bottom of this page.
For the Natural Resource Protection Indicator (NRPI), all scores by biome are capped at 17%, which is the target established at the 10th Conference of Parties of the Convention on Biological Diversity (Nagoya, Japan). The scores are capped so that protection levels greater than 17% in a given biome does not offset less than 17% protection in another biome. Since the range of protection levels across all countries is from 0-17%, the proximity to target scores is then calculated as the ratio of the weighted biome protection percentage to 17%, multiplied by 100. Thus, a country with 5% weighted biome protection would be calculated as follows: 5/17 = 0.29411; 0.29411 x 100 = 29.41.
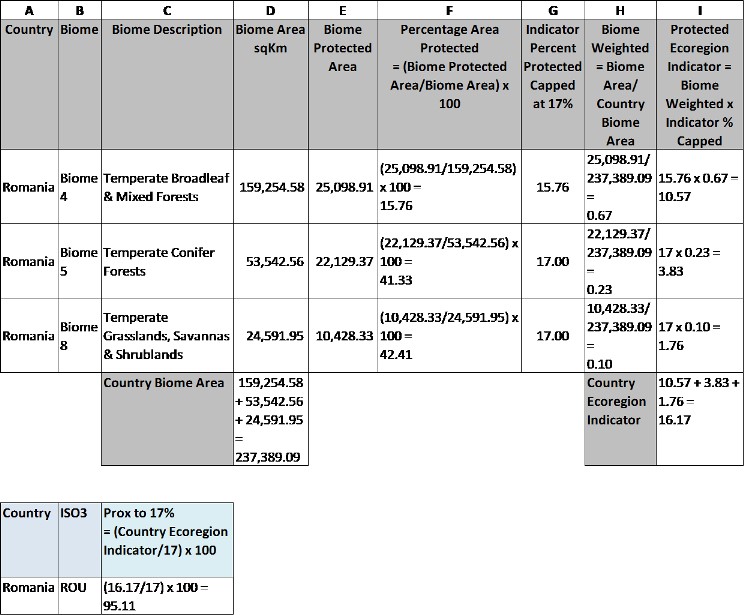
Details on the NRPI methodology for Romania are presented in the table below. Romania has three biomes. First the biome protected area (Column E) is divided by the total biome area (Column D) and the result is a percentage area protected (Column F). As stated, where there is greater than 17% protection (e.g. for Biome 5 and Biome 8), this is capped at 17% (Column G). Next, the proportion of Romania’s land area in each biome class is calculated so as to weight the three scores (Column H). The final column represents the result of the score weighting for the three biomes (Column I). These are then summed, and the total is divided by 17 (bottom left) to produce an overall score of 95.11.
Child Health Indicator
The Child Health Indicator (CHI) is a simple average of the three proximity-to-target scores for access to adequate sanitation, access to improved water, and child mortality. For access to adequate sanitation and access to improved water, the proximity-to-target measure is equal to the reported percentage. For example, if a country has 84% of its population with access to adequate sanitation, it is considered to have a proximity-to-target score of 84. For child mortality, we compute the ratio of the measured probability of dying to the highest observed probability of dying in the whole time series, which was 9.99 per 100 children in Mali in 2006, multiply that by 100, and then subtract from 100 to normalize it on the 0-100 scale (the formula is 100 - ((country value) / 9.99) * 100). For example, a country whose children in the 1-5 age group have a probability of dying of 0.4 per 100 would have a proximity-to-target score of 95.9 (or 100 - ((0.4/9.99) * 100)).
Note that if values are missing for either water or sanitation (but not both), it is assumed that the score for the missing value is the same as the one that is available. The water and sanitation access estimates were published by the Joint Monitoring Program every two years until 2012, and then annually after that. We use earlier values where available to fill in gaps so that countries are not penalized for not having up-to-date estimates. However this gap filling with earlier data is only performed when both water and sanitation measures are available for the earlier time periods, and not when a country is missing one of the two.
Additional Details on the NRPI
What it measures
This indicator measures the degree to which a country achieves the target of protecting at least 17% of each terrestrial biome within its borders. We adopted a target of 17% of each biome protected because on the basis of the updated target established at the Convention on Biological Diversity Conference of Parties 10 in Nagoya, Japan. We treat protected status as a necessary but not sufficient condition for an ecological region to be "effectively conserved." How well protected areas are managed, the strength of the legal protections extended to them, and the actual outcomes on the ground, are all vital elements of a comprehensive assessment of effective conservation. Such measures are not available on a widespread basis, though there are efforts underway to fill critical gaps (Chape et al, 2005, 452).
The target as expressed by the CBD and the conservation community more generally refers to "ecological regions." To make this metric concrete we had to choose a specific data set accepted in both scientific and policy-making circles. We used the Olson et al (2001) delineation of "biomes" for this purpose. Biomes are broad terrestrial ecological regions. Nested within the biomes are what the authors call "ecoregions," which are finer-scale areas sensitive to more specific ecological patterns. These "ecoregions" are probably more appropriate as policy targets, because they identify areas based on factors that affect biodiversity on the ground more precisely than biomes. However, given the scale of the present analysis (global 1-km grids) and the processing time requirements, it was determined that using ecoregions as the unit of analysis would not be possible (see Caveats section below).
Data Set Preparation
We utilized the March 2015 World Database of Protected Areas (WDPA) maintained by UNEP’s World Conservation Monitoring Centre (WDPA 2015). As with prior versions of the WDPA, the 2015 release includes both points and polygon layers. The protected areas represented by polygons, which provide the actual boundaries, are a subset of the protected areas represented by points.
We excluded protected areas that were listed as proposed but not yet designated. For protected areas that had point and area information but not an explicit polygon identified, we created a circular buffer around the point with a total area equivalent to the area listed in the database. However, where PAs are near a country’s border, the buffered point is arbitrarily clipped to the border (so as not to spill over into neighboring countries), thereby losing a certain percentage of the total area. (Countries are encouraged to provide protected area boundary data to the WCMC WDPA team.) Marine Protected Areas whose points were located offshore were excluded from this step. To avoid over-counting overlapping protected areas, the dissolve command in ArcMap was used to create a consolidated set of polygons that distinguished areas that were under protected status from those that were not.
We used a high resolution and spatially accurate coastline dataset developed by ISciences L.L.C (ISciences 2009). The ISciences coastline data has higher resolution (3 arc-second, or approximately 90m).
The biome data were obtained from WWF’s Terrestrial Ecoregions of the World (Olson et al. 2001). Rather than utilize the 200 ecoregions, many of which are quite small, we utilized 14 terrestrial biomes identified in the data set. Because we are measuring the extent of terrestrial protected areas, biome 98 (water) was excluded. We manually extended the WWF Terrestrial biome data to match ISciences coastline data to ensure that all areas particularly along the coast or small islands are assigned a biome type.
We do not include protected areas that are listed as "International" in the World Database on Protected Area (WDPA). The vast majority of such internationally designated protected areas, which include World Heritage, Ramsar, and Biosphere Reserve sites, are contained in either the IUCN I-VI or the "no category" national protected area databases of the WDPA, meaning that they have some national legal status. Where they have no national legal status, such protected areas cannot be considered to be adequately protected. This decision is supported by the common practice of many studies that utilize the WDPA to assess the protected status of a nation’s territory.
Methods
In order to compute what proportion of each biome in a country is protected, we first created a composite layer consisting of country boundaries (ISciences 2009), WWF’s terrestrial biomes layer and the consolidated country protected area polygon layer for each year. The area for each unique polygon in the composite layer was computed in square kilometers. The attribute table of the layer was exported into an Excel spreadsheet for final tabulation. The tabular data set quantifies, for each country, the total area of each biome and the total area of each biome that is protected. The percentage of each biome that is protected was calculated. The percentage was capped at 17%, so that additional "credit" does not accrue where protection exceeds 17%. The countries overall score is a weighted average of the protection score for each biome. The weights are derived by calculating the biome area as a fraction of a country’s overall land area. Greater weights are applied to larger biomes.
Caveats
Spatial errors are always a possibility when combining multiple global, 1:1m scale data sets for analytical purposes. Uncertainty about the exact location of boundaries of some protected areas, especially those represented by creating circles around points, and the potential spatial mismatch between the protected areas layer and the biome-country layer represent potential sources of error. Also worth mentioning is that the WDPA database has been a work in progress since 2006. Over the years, as relatively accurate boundary data becomes available, point protected areas are replaced with boundary delineations that often result in a changes in total area under protection.
To streamline the processing steps we performed geospatial processing such as point PA buffering and country-biome-PA separately for each country before importing areas into the ecoregion protection indicator calculator. A major benefit of this change is eliminating over-estimation of PAs as a result of point buffers in adjacent countries from spilling over into neighboring countries thereby inflating the overall ecoregion protection score.
Notes on Updates
The NRPI is equivalent to the "ecoregion protection indicator" of the Natural Resource Management Index (NRMI). Note that until 2011 the protection target was 10% of each biome. From 2012 onwards the target was moved to a weighted average of 17% of biome area protected, which is based on a revised target established by the CBD in Nagoya, Japan, October 2010.
Until the 2012 release, we relied on annual releases of the UNEP-World Conservation Monitoring Centre World Database of Protected Areas (WDPA) to establish our time series, such that the 2006 ecoregion protection indicator would have been based on the 2006 release of the WDPA, the 2007 ecoregion protection indicator on the 2007 release, and so on. From 2012 onwards we have used the most recent monthly release of the WDPA, and the time series is developed based on the date of establishment of the protected area. Thus, if better boundary data become available for a given protected area, it will be reflected across the entire series from the date of its establishment onwards. The goal is to ensure that any changes in percent of biomes protected in a given release will be due to actual changes in protected status and not due to improvements to the database.
References
Chape, S., J. Harrison, M. Spalding and I. Lysenko, 2005. "Measuring the Extent and Effectiveness of Protected Areas as an Indicator for Meeting Global Biodiversity Targets," Philosophical Transactions of the Royal Society, B 360: 443-455. http://dx.doi.org/10.1098/rstb.2004.1592
ISciences, LLC. 2009. Global Coastline v1. Ann Arbor, MI.
Olson, D.M., E. Dinerstein, E.D. Wikramanayake, et al. 2001. Terrestrial Ecoregions of the World: A New Map of Life on Earth, Bioscience 51(11): 933-938. http://dx.doi.org/10.1641/0006-3568(2001)051[0933:TEOTWA]2.0.CO;2
World Conservation Monitoring Center of the United Nations Environment Programme (UNEP-WCMC). 2015. World Database on Protected Areas (WDPA), July 2015 Release [Downloaded: March 2015]. The WDPA is a joint product of UNEP and IUCN, prepared by UNEP-WCMC, supported by IUCN WCPA and working with Governments, the Secretariats of MEAs and collaborating NGOs. For further information: protectedareas@unep-wcmc.org or http://www.wdpa.org/.