NASA Website Socioeconomic Data and Applications Center (sedac)
A Data Center in NASA's Earth Observing System Data and Information System (EOSDIS) — Hosted by CIESIN at Columbia University
Data
  • Data Sets
  • Maps
  • Web Pages
  • home
  • Data
    • · Data Sets
    • · Data Collections
    • · Featured Data Uses
    • · Data Citations
    • · Citations Database
    • · Data Submission
  • Maps
    • · Map Gallery
    • · Map Viewer
    • · Map Services
    • · Mapping Tools
  • Themes
    • · Agriculture
    • · Climate
    • · Conservation
    • · Governance
    • · Hazards
    • · Health
    • · Infrastructure
    • · Land Use
    • · Marine and Coastal
    • · Population
    • · Poverty
    • · Remote Sensing
    • · Sustainability
    • · Urban
    • · Water
  • Resources
    • · Guides
    • · Multimedia
    • · Networks
    • · News
    • · Publications
    • · Related Sites
    • · Remote Sensing
    • · Tools
  • Social Media
    • · Twitter
    • · FaceBook
    • · YouTube
    • · Flickr
    • · Blog Posts
    • · Communities
  • About
    • · About SEDAC
    • · User Working Group
    • · Privacy
    • · User Registration
  • Help
 

Land Use and Land Cover Change

Follow Us: Twitter Follow Us on Facebook YouTube Flickr   |   Share: Twitter Facebook
  • Theme Home
  • Data Sets
  • Map Gallery
  • Map Services
  • Featured Data Uses
  • Resources
    • Guides
    • Multimedia
    • Networks
    • Related Sites
    • Remote Sensing
    • Tools

Mapping Population and Geographic Data

The New Security Beat – September 24, 2009
Mapping Population and Geographic Data - Marc Levy

In this blog for the Center Environmental and Security Program (ECSP), CIESIN deputy director Marc Levy talks with ECSP director Geoff Dabelko about using the Gridded Population of the World (GPW) data product to aid in combining population and geographic data.

Africa Human Footprint Map

National Geographic – May 19, 2011
National Geographic Africa Human Footprint

A map of SEDAC′s the Human Footprint illustrates the extent to which Africa′s land area is influenced by humans.

Visualizing the Global Extent of Cropland and Pastures

Food: An Atlas – June 11, 2014
Visualizing the Global Extent of Cropland and Pastures

The SEDAC Global Agricultural Cropland and Pasture data sets are presented in Food: An Atlas, which uses maps to explore global food distribution and production.  The cropland and pasture data, originally developed by Ramankutty et al (2008), are transformed into cartograms, in which the land area of countries is replaced by extent of crops and pastures, by Benjamin Hennig to better visualize the magnitude of agricultural areas around the world.

Fire Activity and Net Primary Productivity

Global Ecology and Biogeography – August 29, 2013
Forest Fire

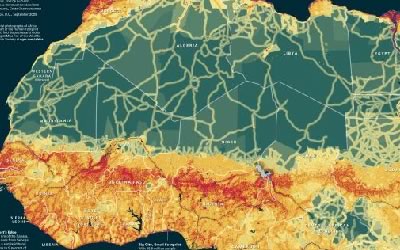
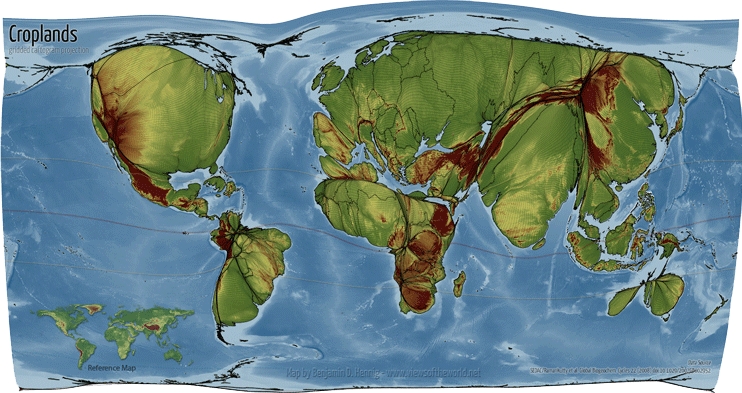
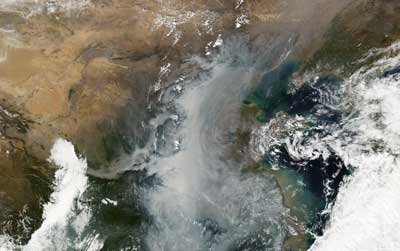
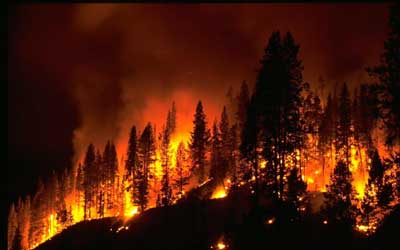
In moist regions around the globe, fire activity is believed to be driven by drought frequency, whereas in dry regions, fire is thought to be limited by the amount of fuel available.  Researchers recently tested these ideas by comparing global fire activity as detected by the NASA Moderate Resolution Imaging Spectroradiometer (MODIS) sensor with measures of vegetation such as net primary productivity from the Human Appropriation of Net Primary Productivity (HANPP) data collection available from SEDAC and the Normalized Difference Vegetation Index (NDVI) derived from NOAA satellite data.  Although fire activity is indeed limited by droughts in moist areas and by fuel in dry regions, human activities—specifically tropical rain forest deforestation and fire suppression policies in the western U.S.—also strongly influence fire activity.

Another Way to Look at an Air Quality Problem

State of the Planet – March 7, 2012
Satellite image of a particularly valuable perspective on PM2

Satellite data offer a particularly valuable perspective on PM2—small particles deriving mostly from burning fossil fuels and biomass, which can harm human health—because ground instruments may be unavailable or offer limited information, as is the case in China. With that in mind, researchers at Columbia University’s Earth Institute and Batelle Memorial Institute have developed maps based on satellite data that depict annual PM2.5 exposure in all of China’s provinces.

Scorecard on the Environment

NASA Earth Data Web Site – December 1, 2007
Scorecard on the Environment

Sensing Our Planet: NASA Earth Science Research Features 2008 features an article on how SEDAC data was used for the 2008 Environmental Performance Index and other environmental assessments; CIESIN’s Marc Levy is interviewed.

Beyond Seven Billion

Los Angeles Times – July 23, 2012
A five-part article examines the implications of world population growth beyond seven billion; SEDAC's Human Footprint data shows where Earth been most impacted.Beyond 7 Billion feature image showing chinese people crowded on an escalator

A five-part article examines the implications of world population growth beyond seven billion; SEDAC's Human Footprint data shows where Earth been most impacted.

Taliban Wages War on Police in Its New Front in Pakistan

The Wall Street Journal – May 28, 2008
Taliban Wages War on Police in Its New Front in Pakistan

Map of Pakistan illustrating areas of escalating violence in the Punjab, the country’s most populous province.

NASA Data Helps Pinpoint Impacted Populations in Disaster Aftermath

Space & Earth science/Earth Sciences – June 13, 2008
NASA Data Helps Pinpoint Impacted Populations in Disaster Aftermath

A map of Burma, based on the SEDAC Gridded Population of the World (GPW) data product, reveals that coastal areas hit hardest by the cyclone in May 2008 were highly populated. (Areas in progressively darker shades of brown represent increased population.)

Home | Data | Data Uses | Data Citations | Maps | Map Services

News | Tools | Guides | Publications | Blog Posts

About | Help | Privacy | User Registration

Copyright © 1997–2023. The Trustees of Columbia University in the City of New York.

WDS ICSU