NASA Website Socioeconomic Data and Applications Center (sedac)
A Data Center in NASA's Earth Observing System Data and Information System (EOSDIS) — Hosted by CIESIN at Columbia University
Data
  • Data Sets
  • Maps
  • Web Pages
  • home
  • Data
    • · Data Sets
    • · Data Collections
    • · Featured Data Uses
    • · Data Citations
    • · Citations Database
    • · Data Submission
  • Maps
    • · Map Gallery
    • · Map Viewer
    • · Map Services
    • · Mapping Tools
  • Themes
    • · Agriculture
    • · Climate
    • · Conservation
    • · Governance
    • · Hazards
    • · Health
    • · Infrastructure
    • · Land Use
    • · Marine and Coastal
    • · Population
    • · Poverty
    • · Remote Sensing
    • · Sustainability
    • · Urban
    • · Water
  • Resources
    • · Guides
    • · Multimedia
    • · Networks
    • · News
    • · Publications
    • · Related Sites
    • · Remote Sensing
    • · Tools
  • Social Media
    • · Twitter
    • · FaceBook
    • · YouTube
    • · Flickr
    • · Blog Posts
    • · Communities
  • About
    • · About SEDAC
    • · User Working Group
    • · Privacy
    • · User Registration
  • Help
 

Environmental Sustainability Indicators and Trends

Follow Us: Twitter Follow Us on Facebook YouTube Flickr   |   Share: Twitter Facebook
  • Theme Home
  • Data Sets
  • Map Gallery
  • Map Services
  • Featured Data Uses
  • Resources
    • Guides
    • Multimedia
    • Networks
    • News
    • Publications
    • Related Sites
    • Remote Sensing

Scorecard on the Environment

NASA Earth Data Web Site – December 1, 2007
Scorecard on the Environment

Sensing Our Planet: NASA Earth Science Research Features 2008 features an article on how SEDAC data was used for the 2008 Environmental Performance Index and other environmental assessments; CIESIN’s Marc Levy is interviewed.

Relationships Between Population Density and Burned Areas Around the Globe

PLoS ONE – February 7, 2014
Relationships Between Population Density and Burned Areas Around the Globe

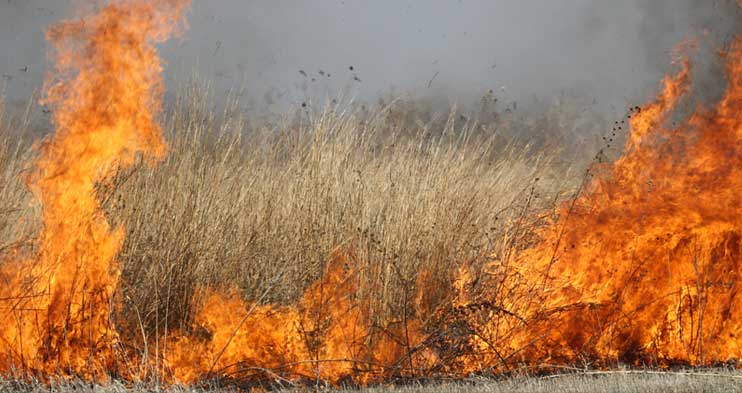
A complex spatial relationship between population density and fire exists across the globe.  This study looked at this relationship by comparing population density data from SEDAC’s Gridded Population of the World to burned area maps based largely on NASA MODIS satellite observations.  In general it finds that in regions where climate or vegetation create conditions where fire is likely, people tend to suppress the fire, whereas in less fire-prone regions people tend to let the fire spread.  In most regions of the world, increased population density initially leads to an increase in burned area but that relationship reverses at higher levels of population density.

Spatial disparities within Urban Settlements

The World Development Report 2009 – March 10, 2009
Map of Spatial disparities within Urban Settlements

A typically higher standard of living in urban areas compared to rural ones does not rule out striking disparities within cities. SEDAC data from its Global Poverty Mapping Project is used as the basis for this  map. Map 1.2, illustration for Chapter 1--Density, The World Development Report Online 2009.

Closed Season

Sensing Our Planet – July 3, 2018
Algae in a groundwater-fed lagoon

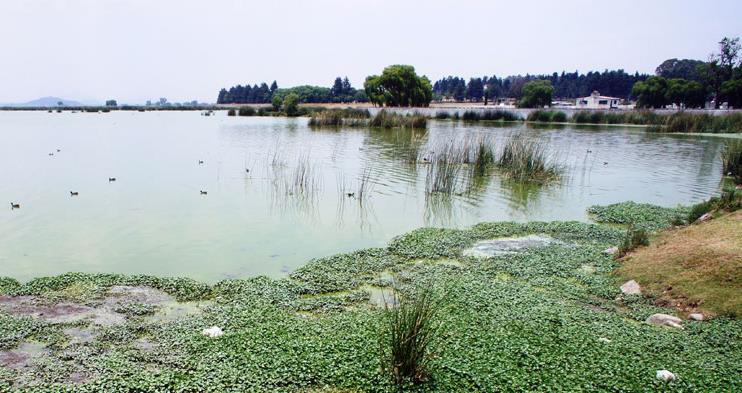
Using data from the NASA Gravity Recovery and Climate Experiment (GRACE) satellite instrument and the Advanced Land Observing Satellite Phased Array type L-Band Synthetic Aperture Radar (ALOS PALSAR) to study land subsidence, and SEDAC’s Gridded Population of the World (GPW), v3 to examine the distribution of people, investigators assessed the loss of groundwater storage in one of Mexico's most important watersheds.

Beyond Seven Billion

Los Angeles Times – July 23, 2012
A five-part article examines the implications of world population growth beyond seven billion; SEDAC's Human Footprint data shows where Earth been most impacted.Beyond 7 Billion feature image showing chinese people crowded on an escalator

A five-part article examines the implications of world population growth beyond seven billion; SEDAC's Human Footprint data shows where Earth been most impacted.

Gridded Population of the World Version 3

National Geographic – May 19, 2011
A map of the Gridded Population of the World Version 3

A map using SEDAC′s Gridded Population of the World data set to illustrate a discussion of population density and population growth, page 50 of the National Geographic Visual Atlas of the World (2009).

Africa Human Footprint Map

National Geographic – May 19, 2011
National Geographic Africa Human Footprint

A map of SEDAC′s the Human Footprint illustrates the extent to which Africa′s land area is influenced by humans.

Another Way to Look at an Air Quality Problem

State of the Planet – March 7, 2012
Satellite image of a particularly valuable perspective on PM2

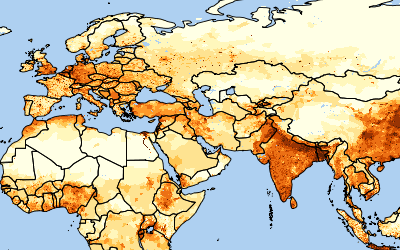
Satellite data offer a particularly valuable perspective on PM2—small particles deriving mostly from burning fossil fuels and biomass, which can harm human health—because ground instruments may be unavailable or offer limited information, as is the case in China. With that in mind, researchers at Columbia University’s Earth Institute and Batelle Memorial Institute have developed maps based on satellite data that depict annual PM2.5 exposure in all of China’s provinces.

A Catalog of Change

Sensing Our Planet: NASA Earth Science Research Features 2009 – November 11, 2009
CIESIN’s role in making climate change data freely available to the public is noted in an article in this annual collection of articles about how scientists use Earth science data to learn about the planet.

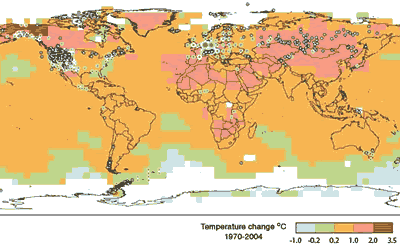
SEDAC′s role in making climate change data freely available to the public is noted in a collection of articles on how scientists use Earth science data to learn about the planet.

Home | Data | Data Uses | Data Citations | Maps | Map Services

News | Tools | Guides | Publications | Blog Posts

About | Help | Privacy | User Registration

Copyright © 1997–2023. The Trustees of Columbia University in the City of New York.

WDS ICSU