Socioeconomic Data and Applications Center (
sedac
)
A Data Center in NASA's Earth Observing System Data and Information System (
EOSDIS
) — Hosted by
CIESIN
at
Columbia University
Search SEDAC
Data
Data Sets
Maps
Web Pages
search
Data
· Data Sets
· Data Collections
· Featured Data Uses
· Data Citations
· Citations Database
· Data Submission
Maps
· Map Gallery
· Map Viewer
· Map Services
· Mapping Tools
Themes
· Agriculture
· Climate
· Conservation
· Governance
· Hazards
· Health
· Infrastructure
· Land Use
· Marine and Coastal
· Population
· Poverty
· Remote Sensing
· Sustainability
· Urban
· Water
Resources
· Guides
· Multimedia
· Networks
· News
· Publications
· Related Sites
· Remote Sensing
· Tools
Social Media
· Twitter
· FaceBook
· YouTube
· Flickr
· Blog Posts
· Communities
About
· About SEDAC
· User Working Group
· Privacy
· User Registration
Help
Map Gallery
(548)
Follow Us:
Twitter
Follow Us on Facebook
YouTube
Flickr
| Share:
Twitter
Facebook
Search
All Fields:
search
Theme
Agriculture
(229)
Climate
(344)
Conservation
(157)
Framework Data
(1)
Governance
(166)
Hazards
(63)
Health
(234)
Infrastructure
(42)
Land Use
(79)
Marine and Coastal
(93)
Population
(140)
Poverty
(32)
remote sensing
(6)
Remote Sensing
(58)
Sustainability
(399)
Urban
(74)
Water
(95)
Maps
»
Region: Global
Remove Facet
5 of 18
Prev
|
Next
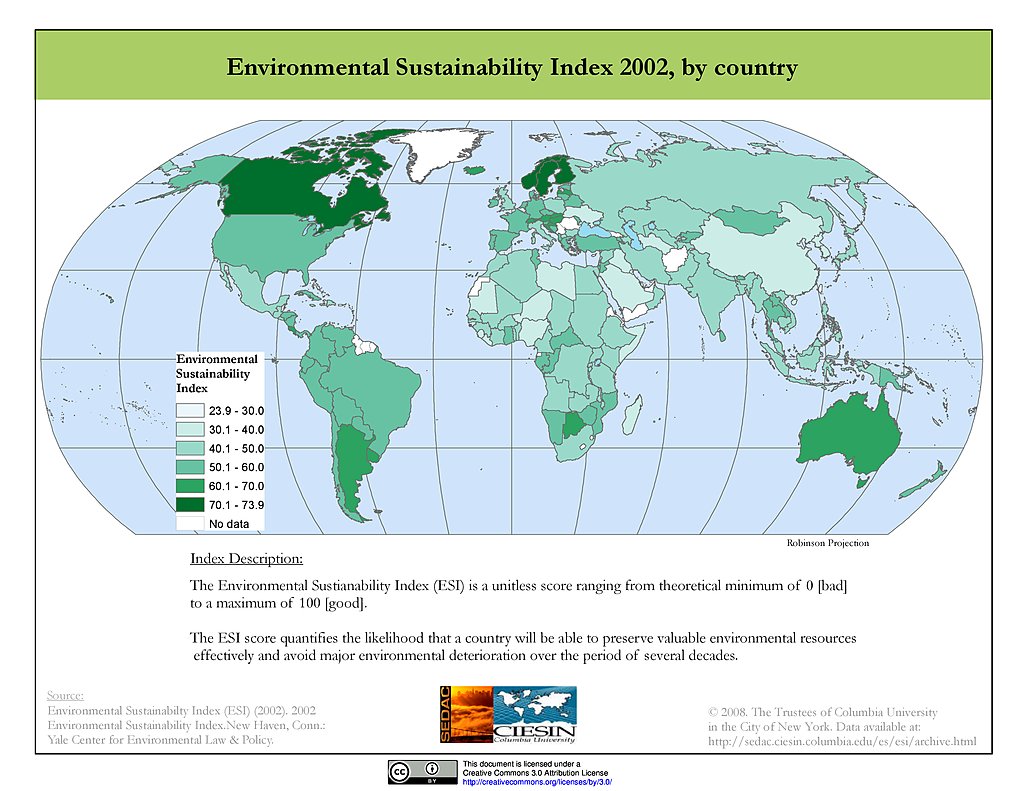
ESI 2002
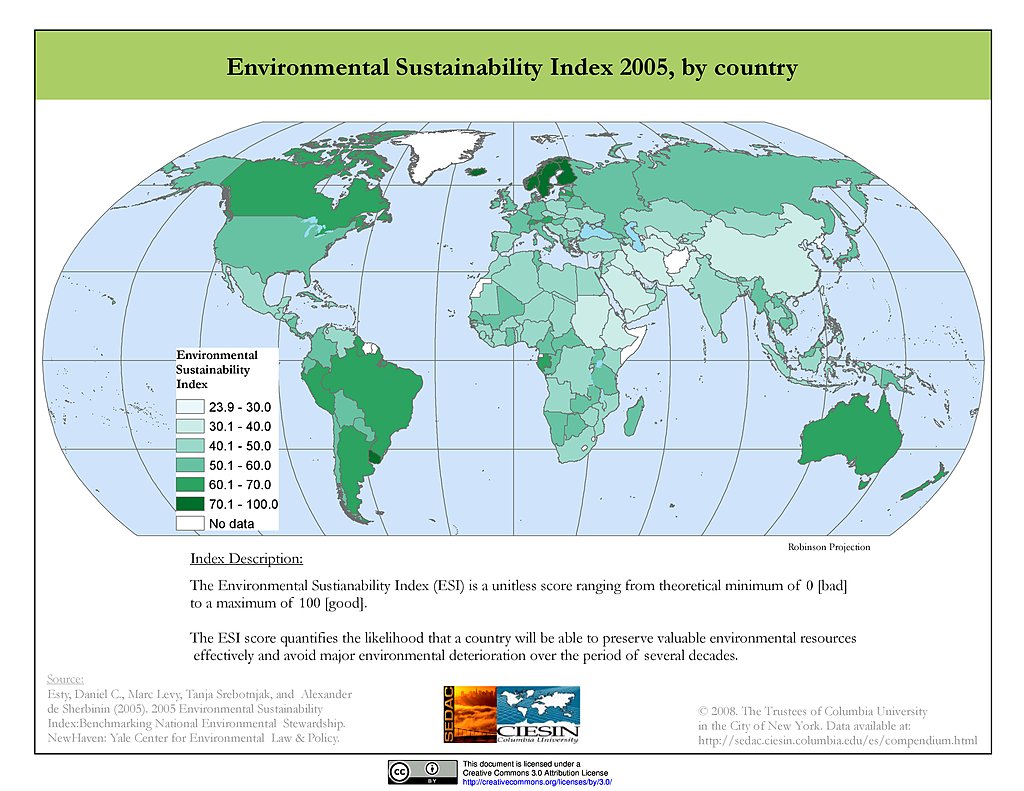
ESI 2005
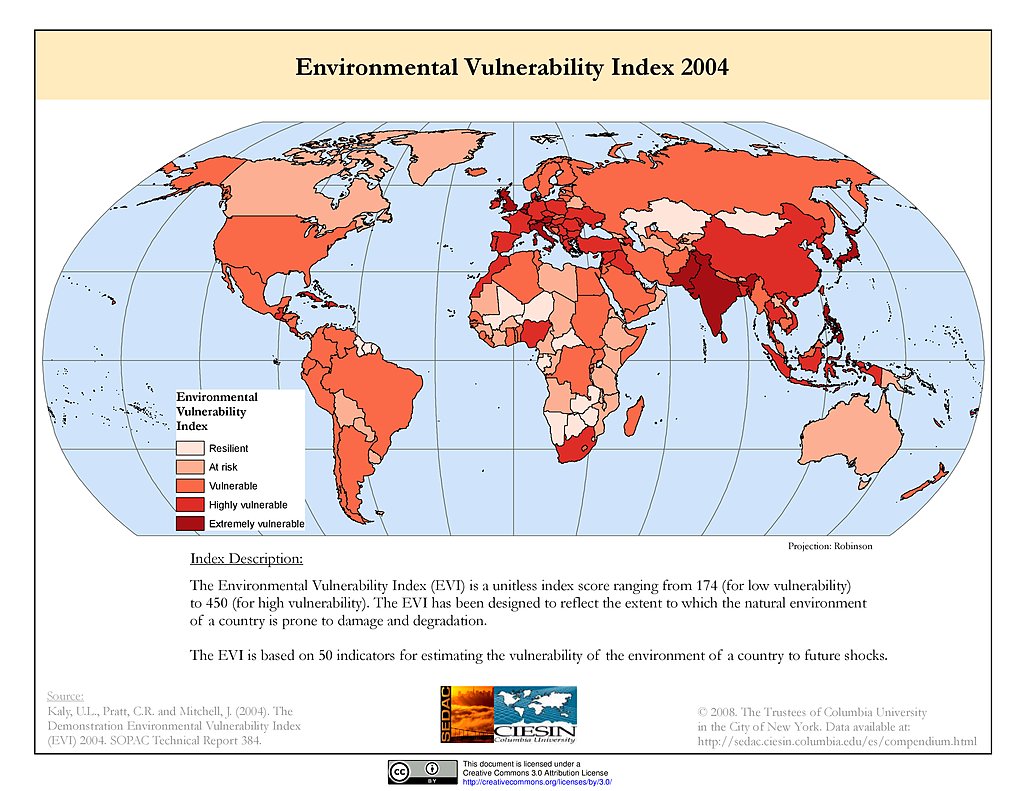
Environmental Vulnerability Index (2004)
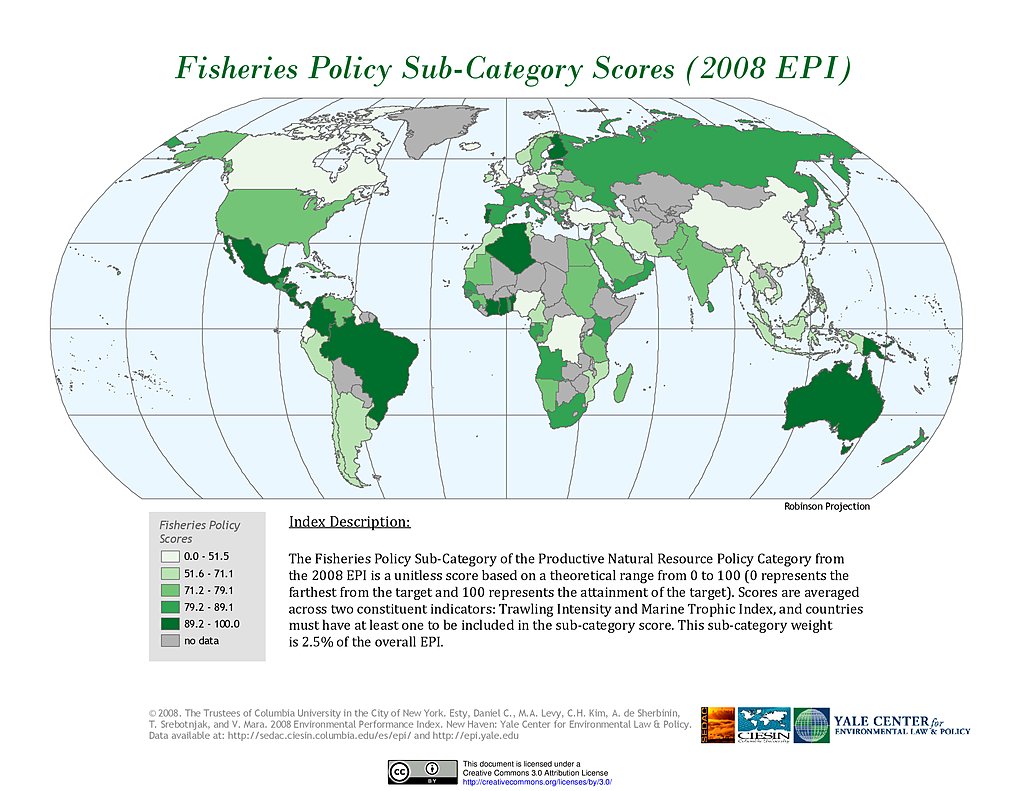
Fisheries, EPI 2008
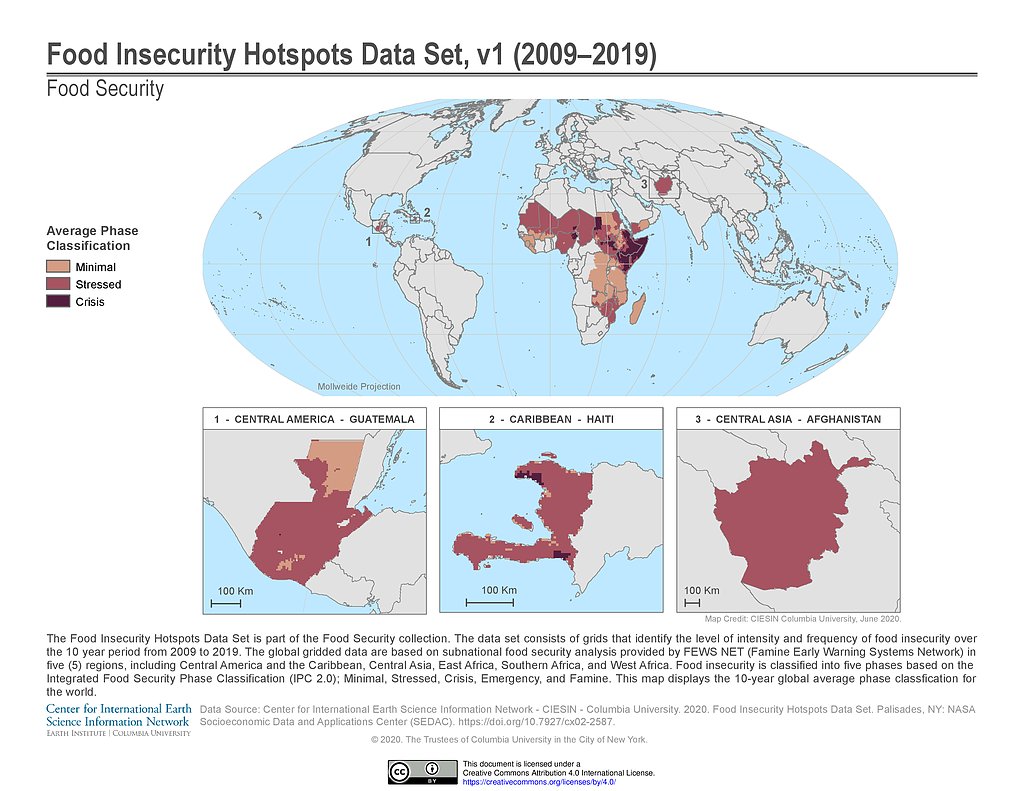
Food Insecurity Hotspots (2009-2019)
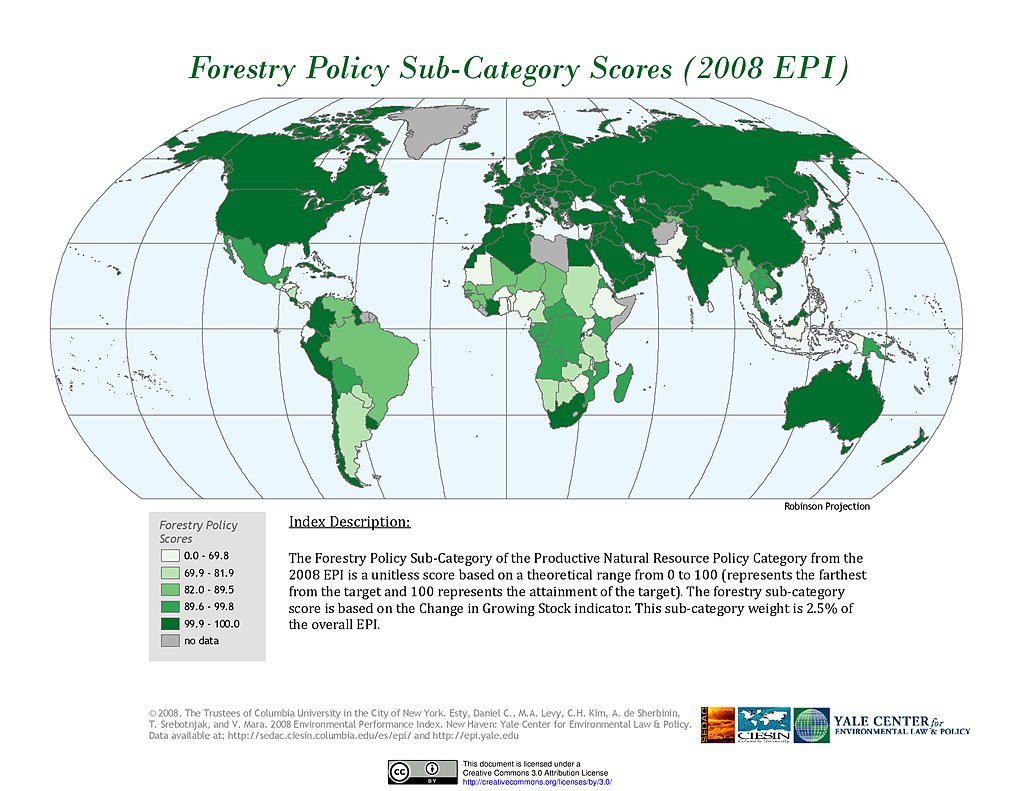
Forestry, EPI 2008
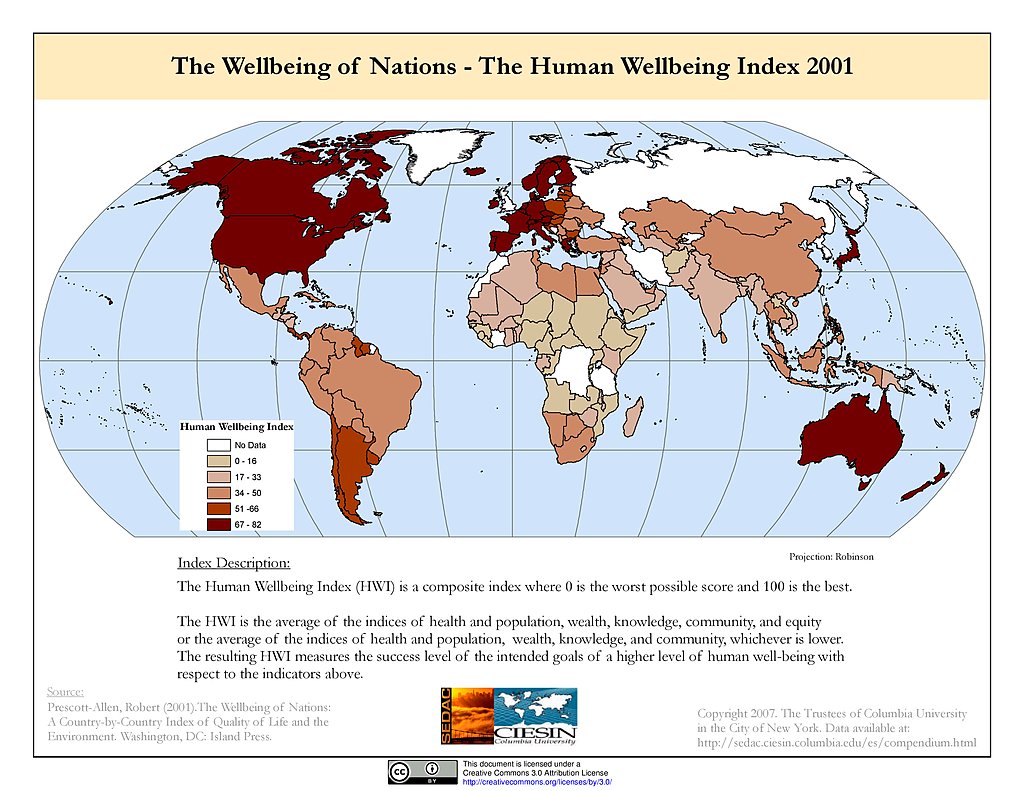
Human Wellbeing Index (2001)
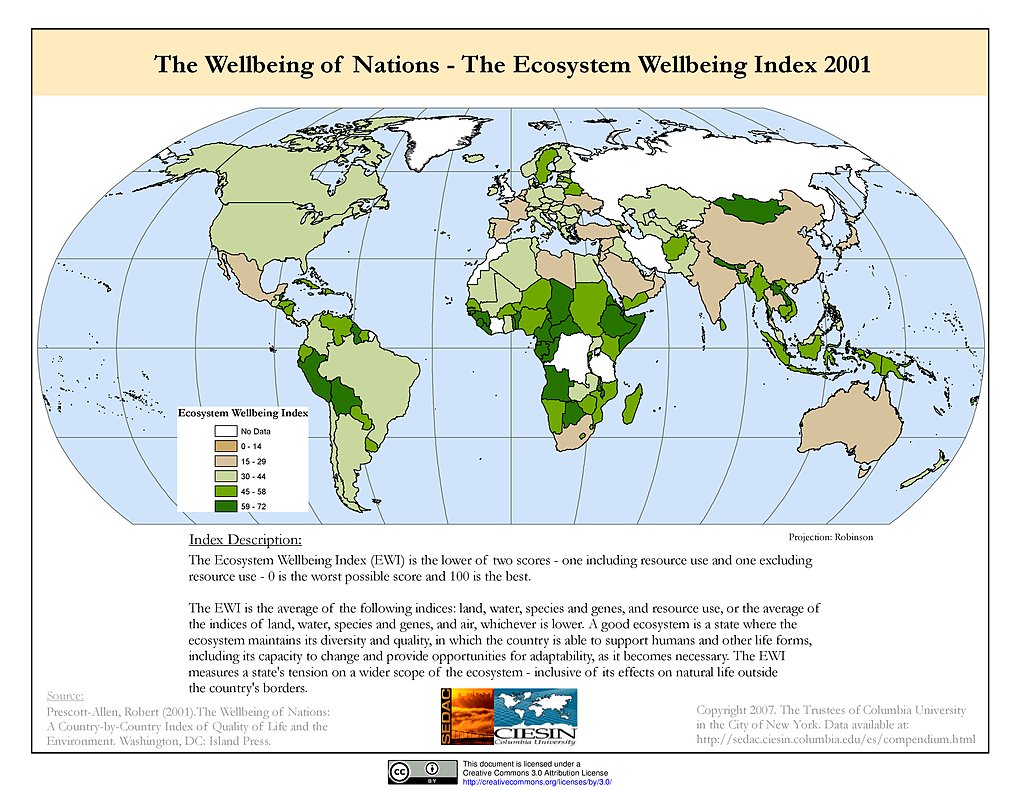
Ecosystem Wellbeing Index (2001)
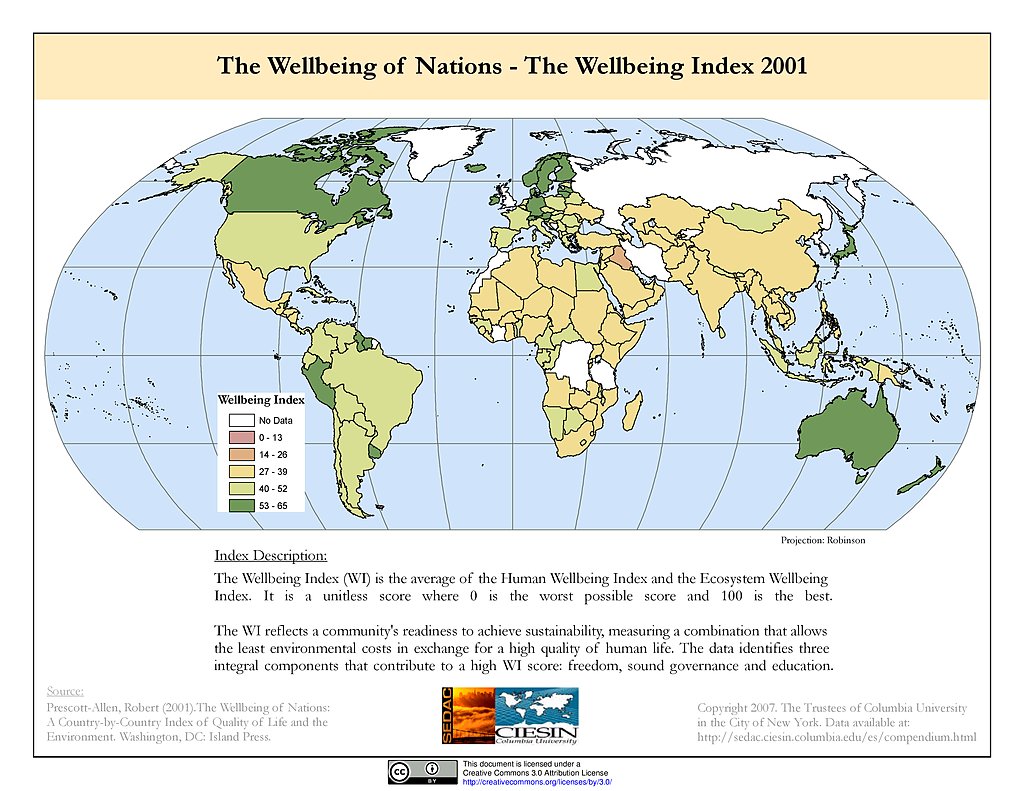
Wellbeing Index (2001)
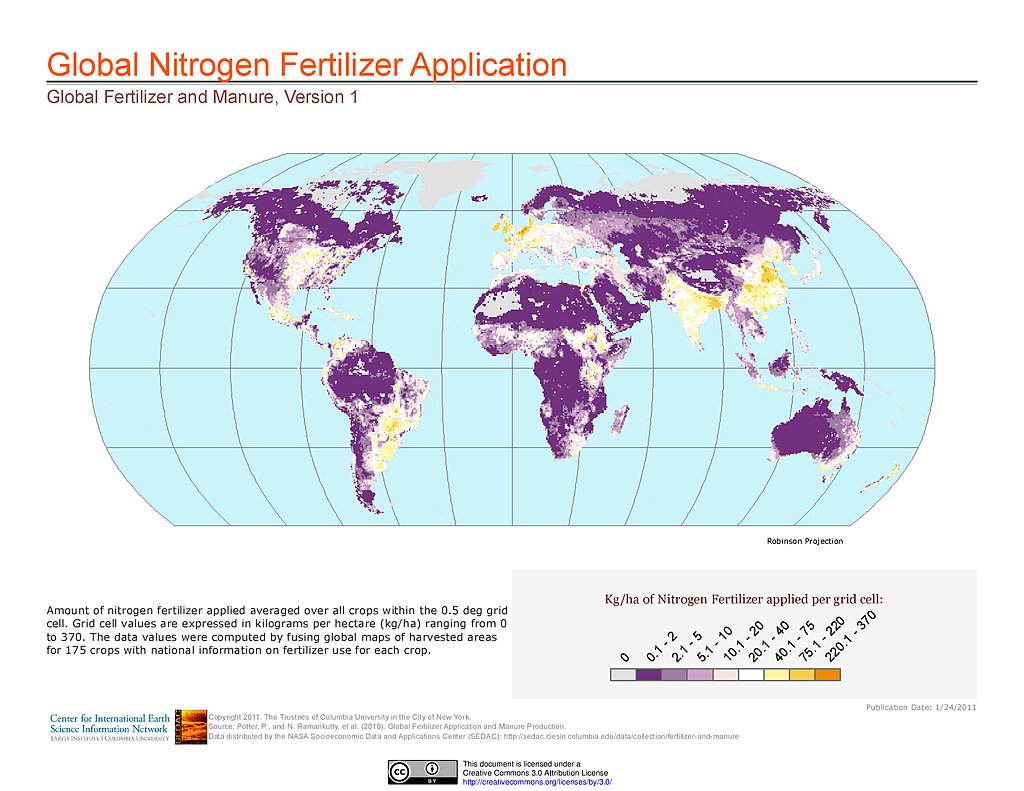
Nitrogen Fertilizer Application
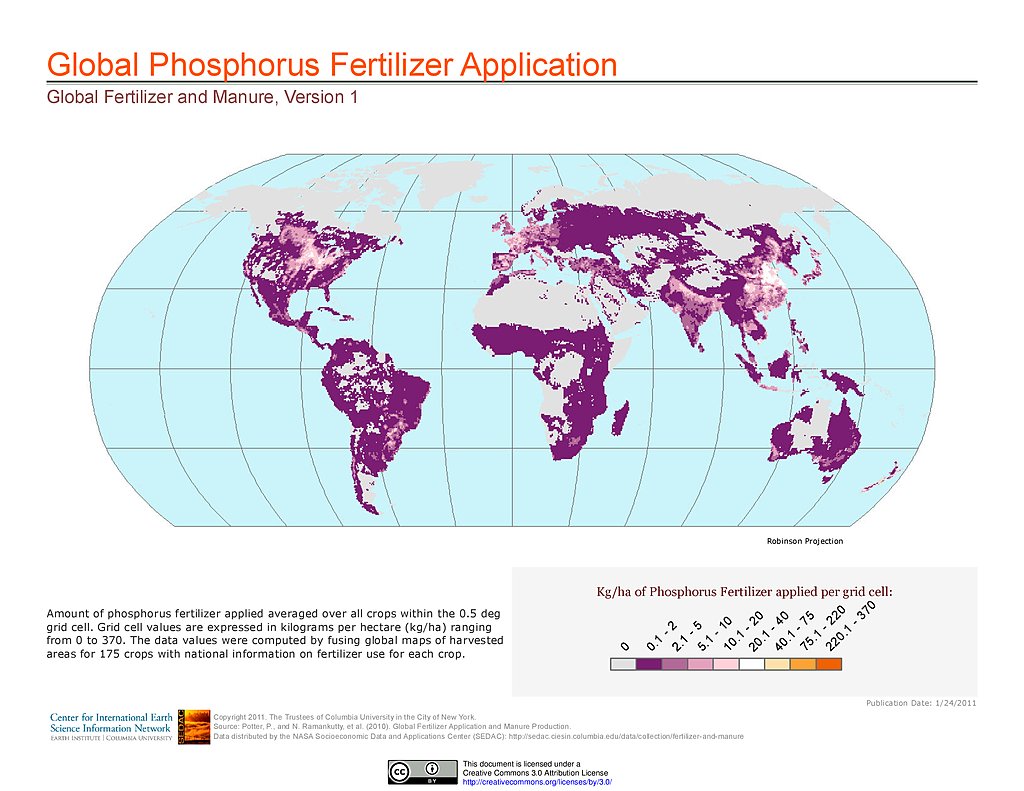
Phosphorus Fertilizer Application
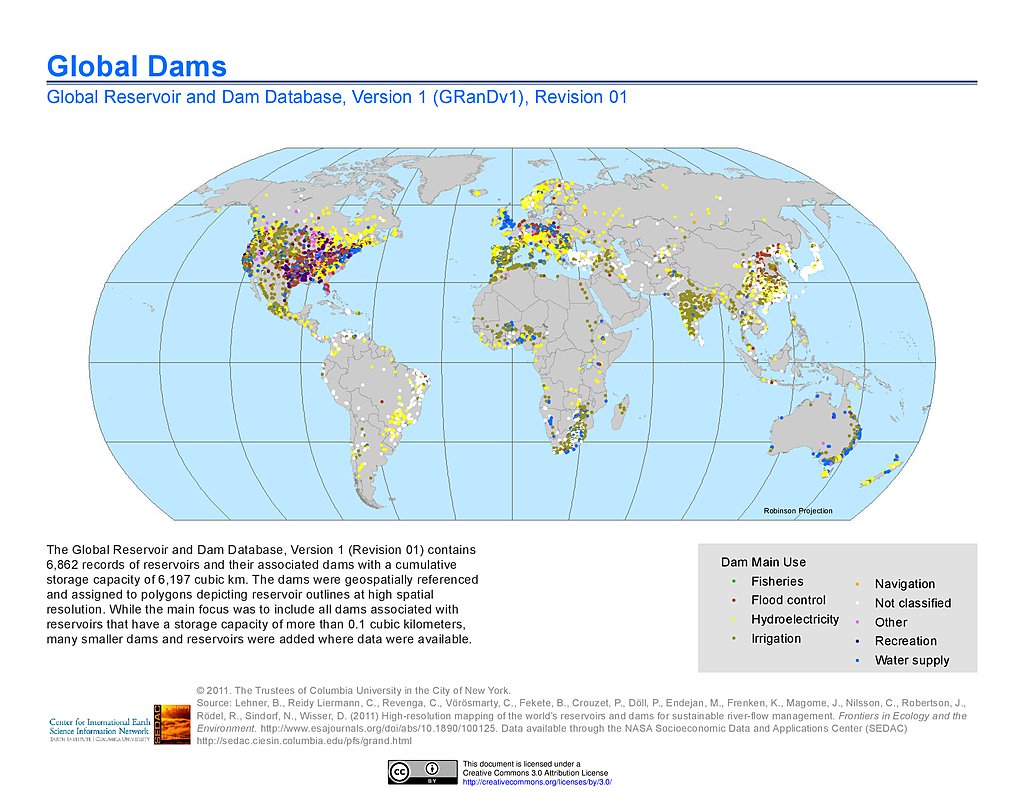
Dams, v1.01
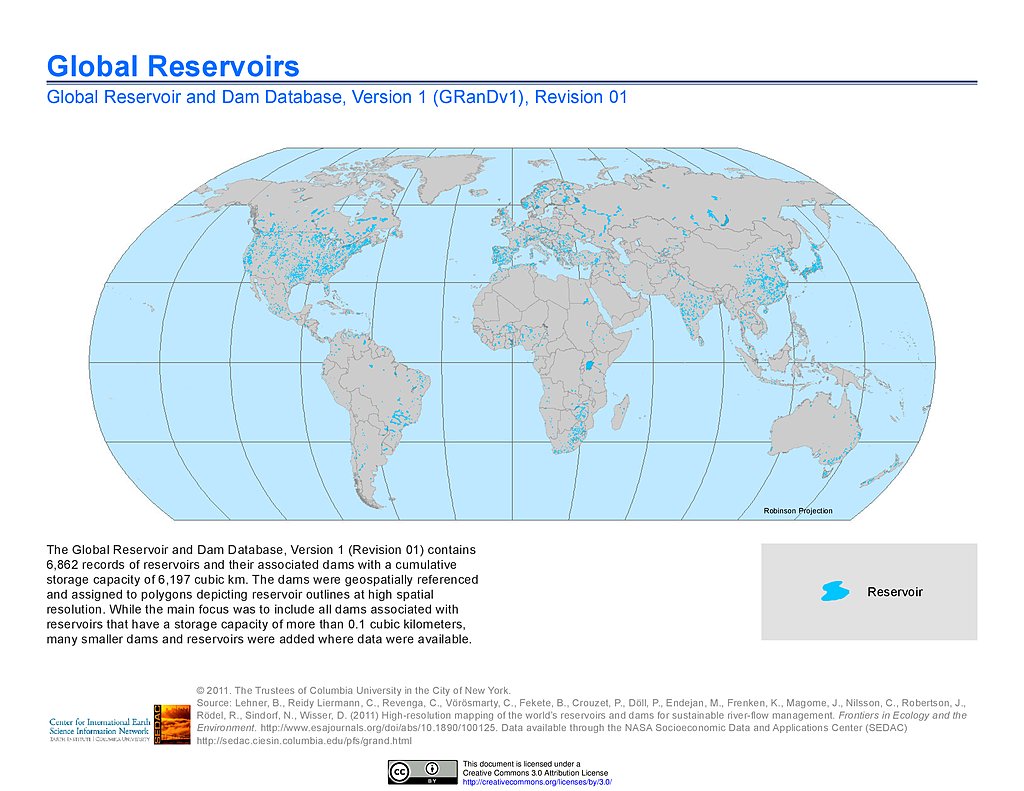
Reservoirs, v1.01
1-km Downscaled Total Population Base Year based on SSPs, v1.01 (2000)
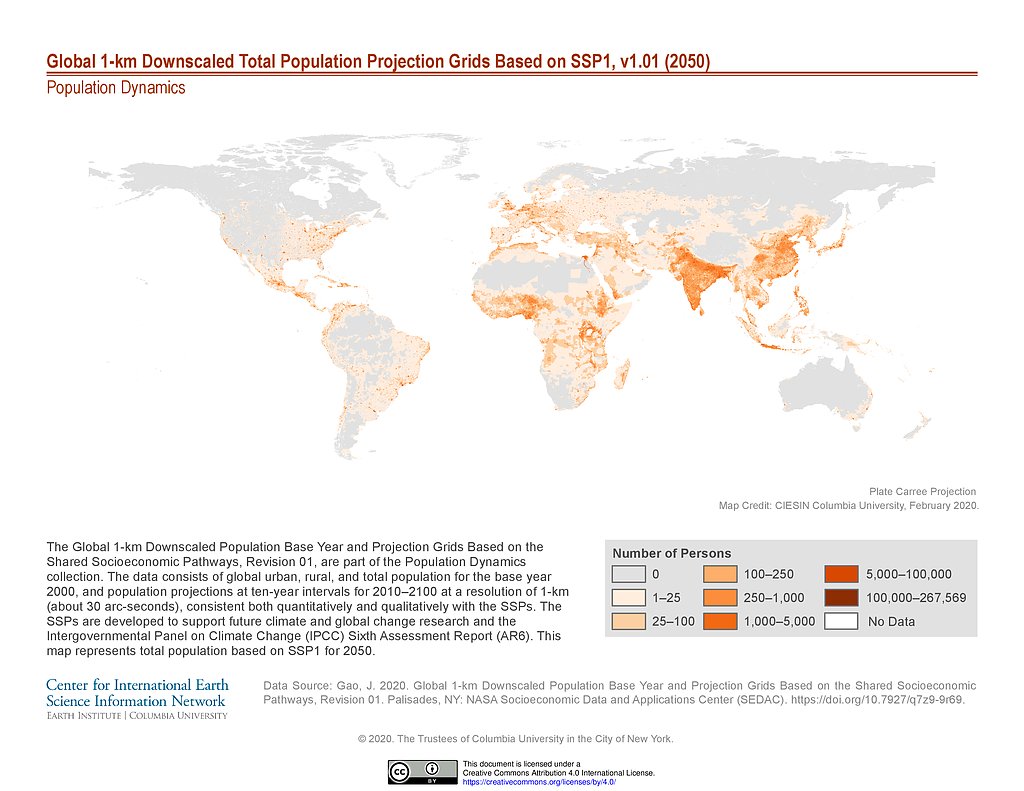
1-km Downscaled Total Population Projection based on SSP1, v1.01 (2050)
1-km Downscaled Total Population Projection based on SSP1, v1.01 (2100)
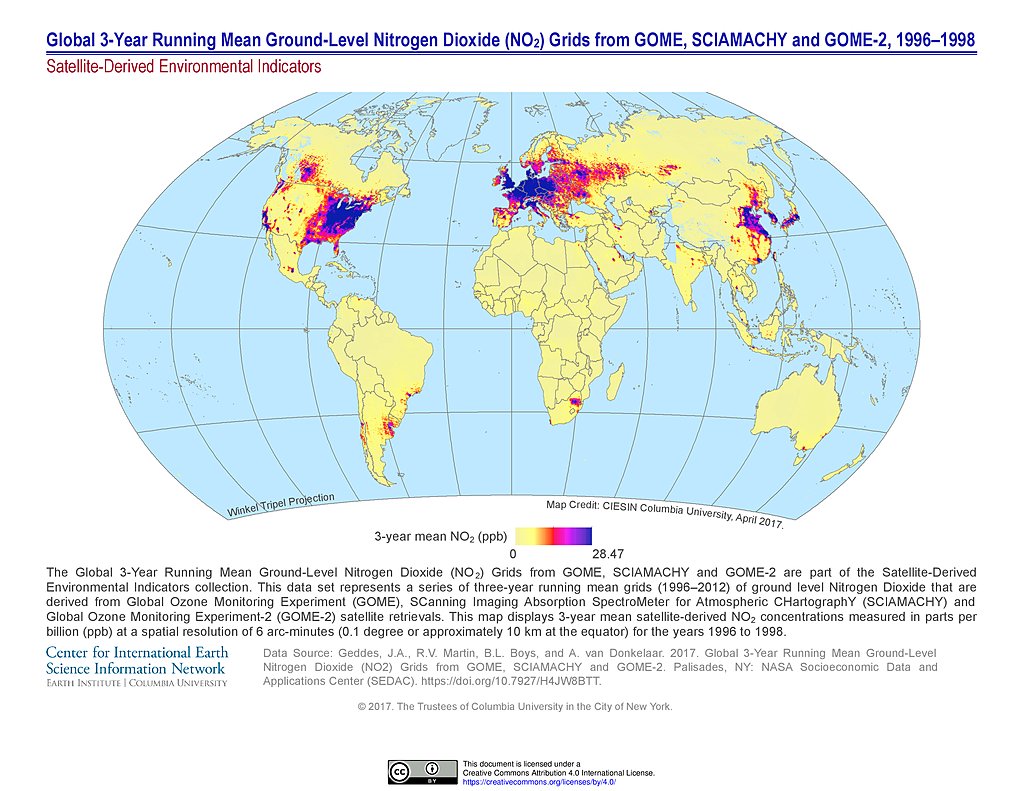
NO2 Grids (1996-1998)
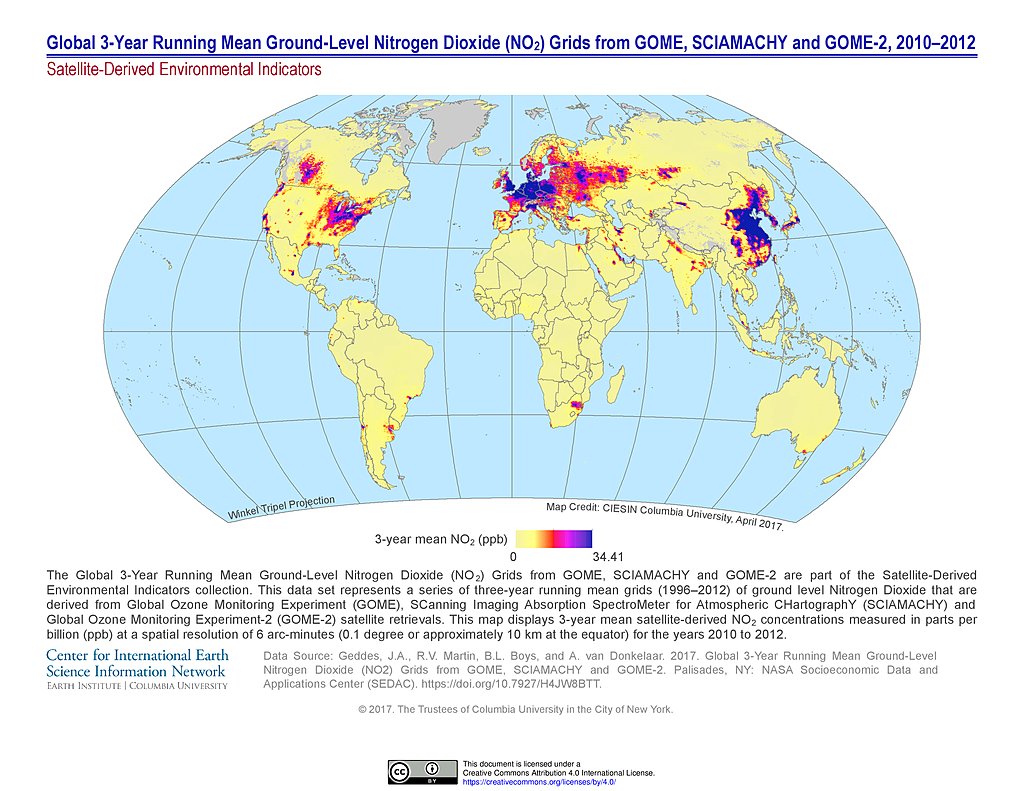
NO2 Grids (2010-2012)
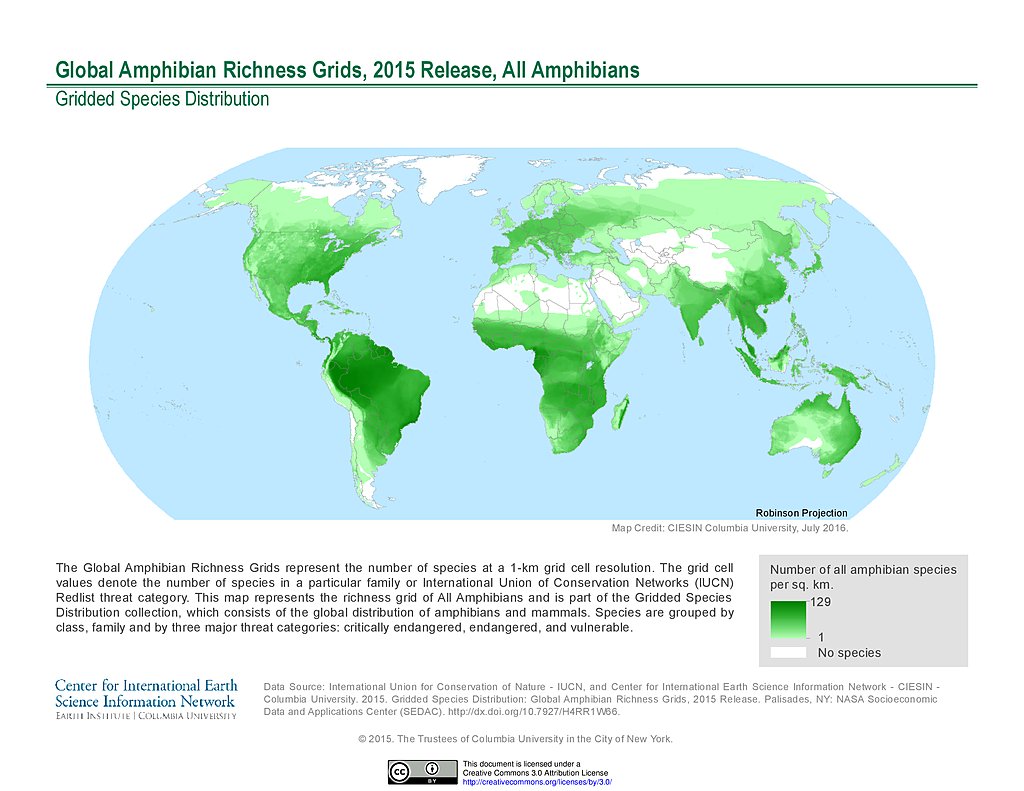
Amphibian Richness, 2015
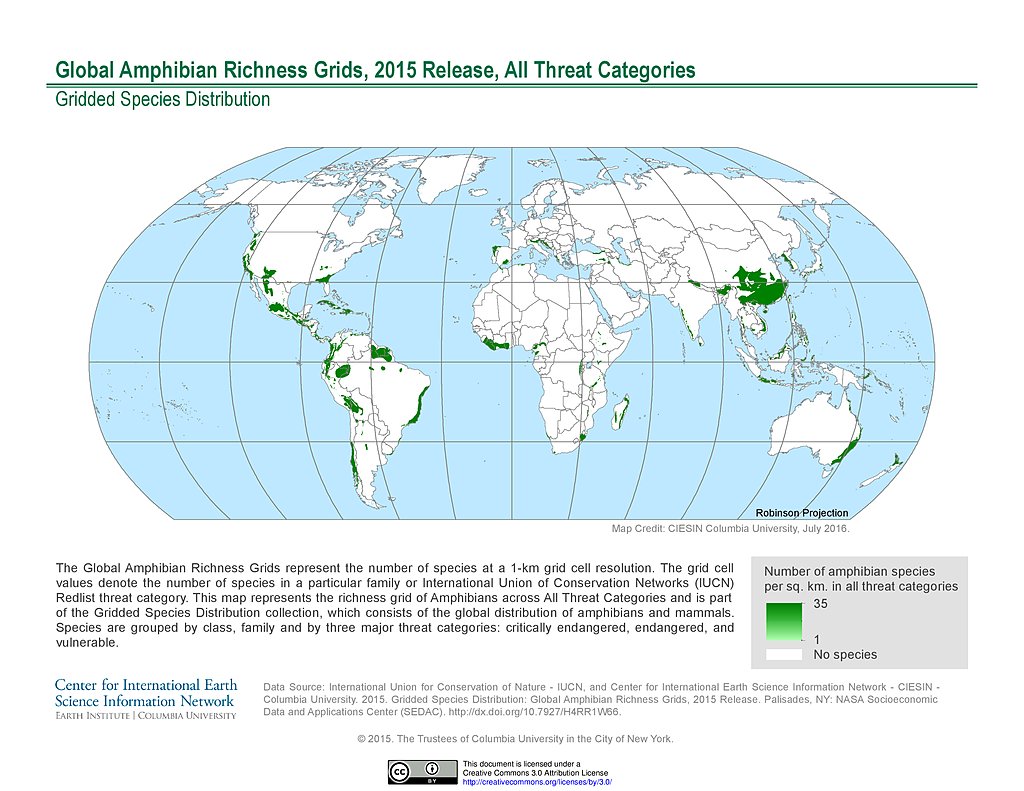
Amphibian Richness - All Threats, 2015
Amphibian Richness - Critically Endangered, 2015
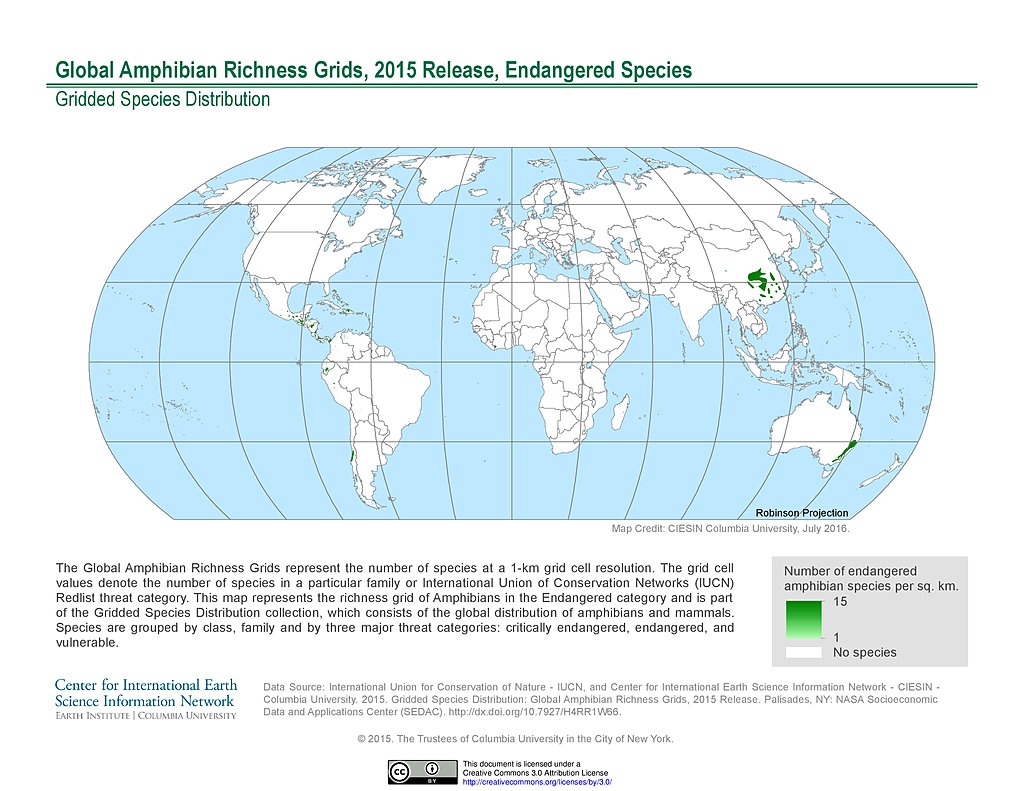
Amphibian Richness - Endangered, 2015
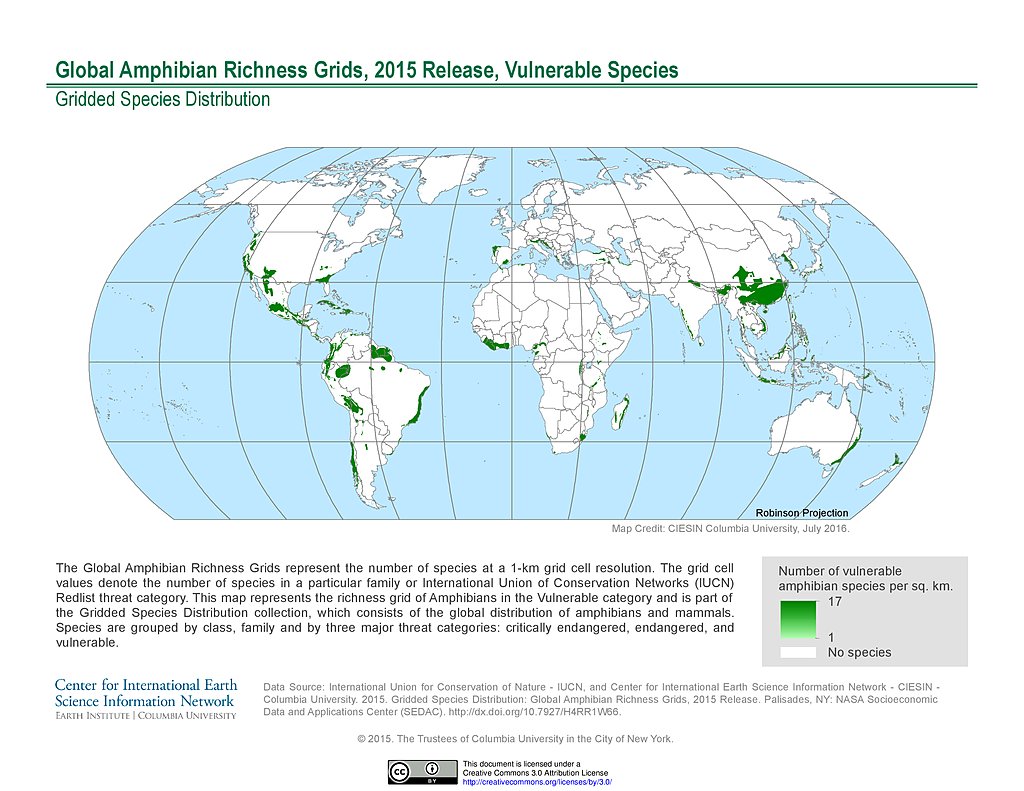
Amphibian Richness - Vulnerable, 2015
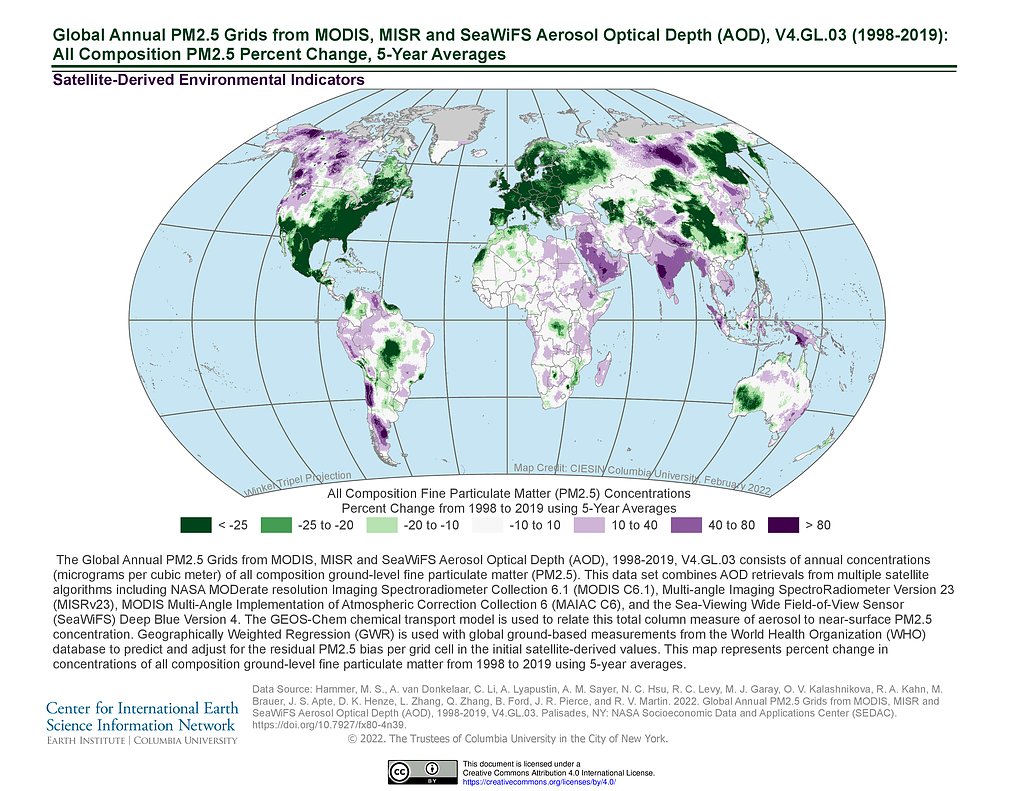
PM 2.5 Grids V4.GL.03 (1998-2019): % Change
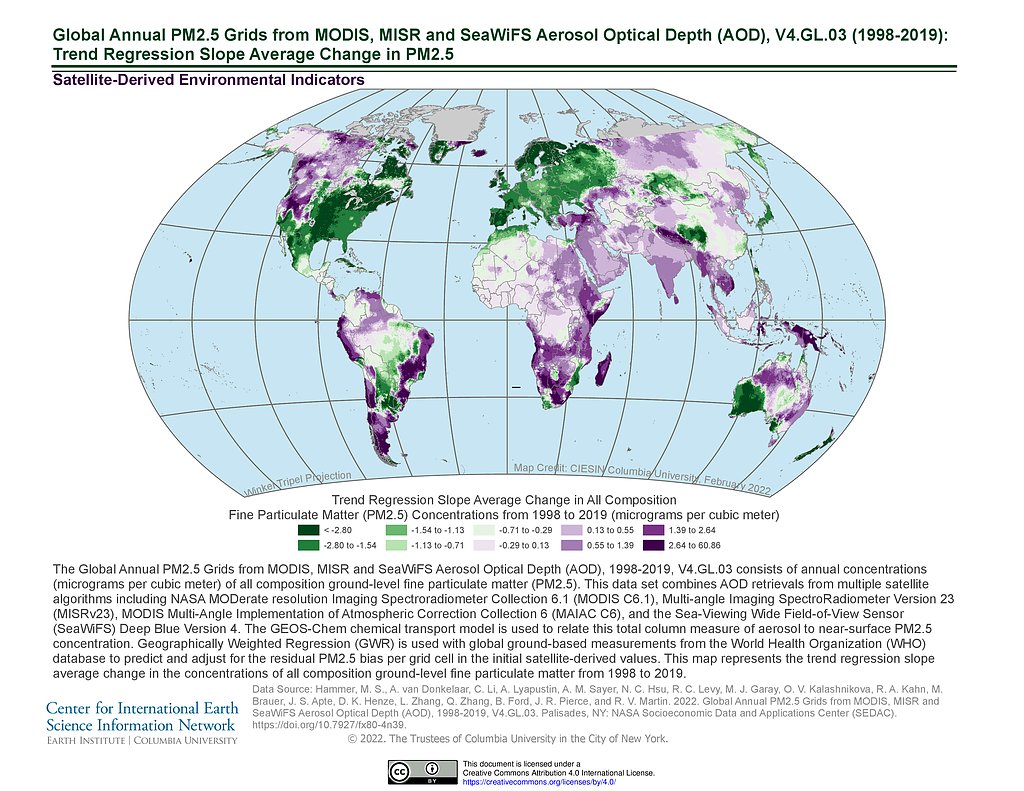
PM 2.5 Grids V4.GL.03 (1998-2019): Trend Avg Change
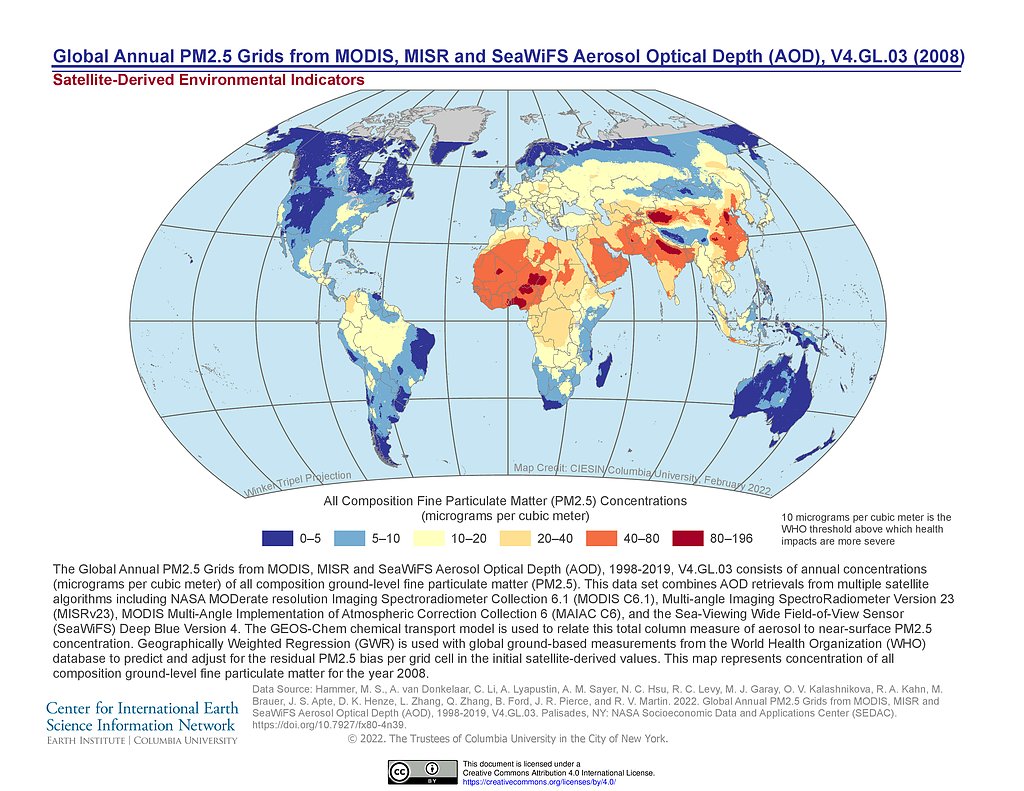
PM 2.5 Grids V4.GL.03 (2008)
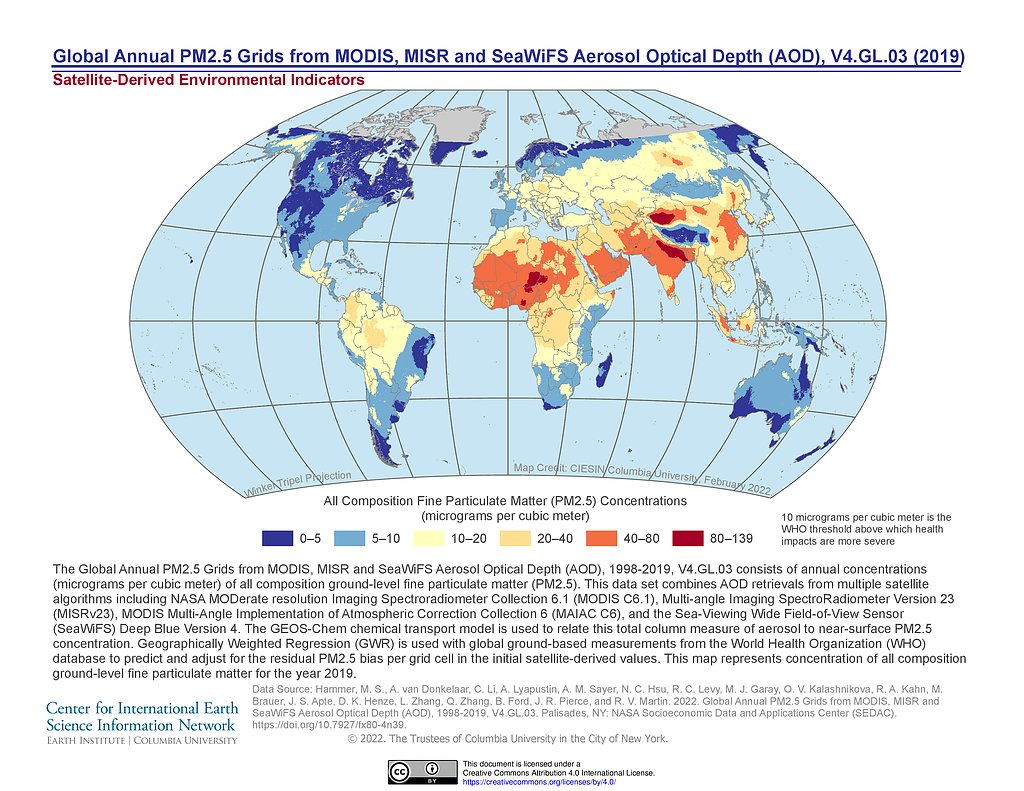
PM 2.5 Grids V4.GL.03 (2019)
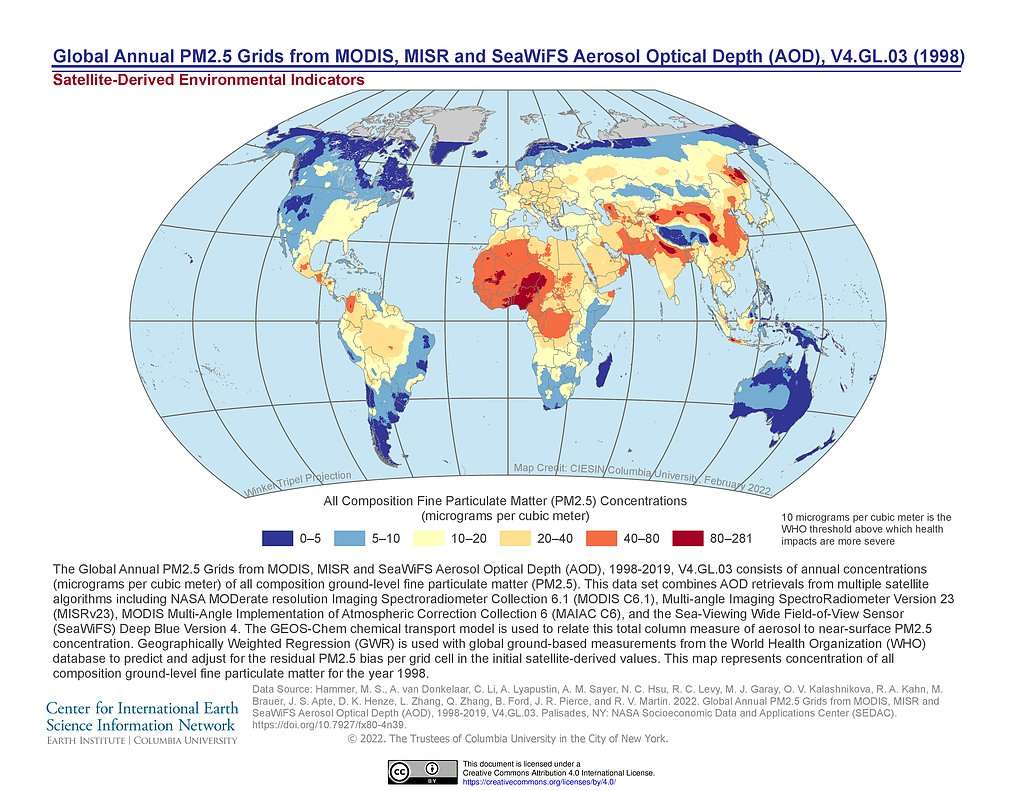
PM 2.5 Grids V4.GL.03 (1998)
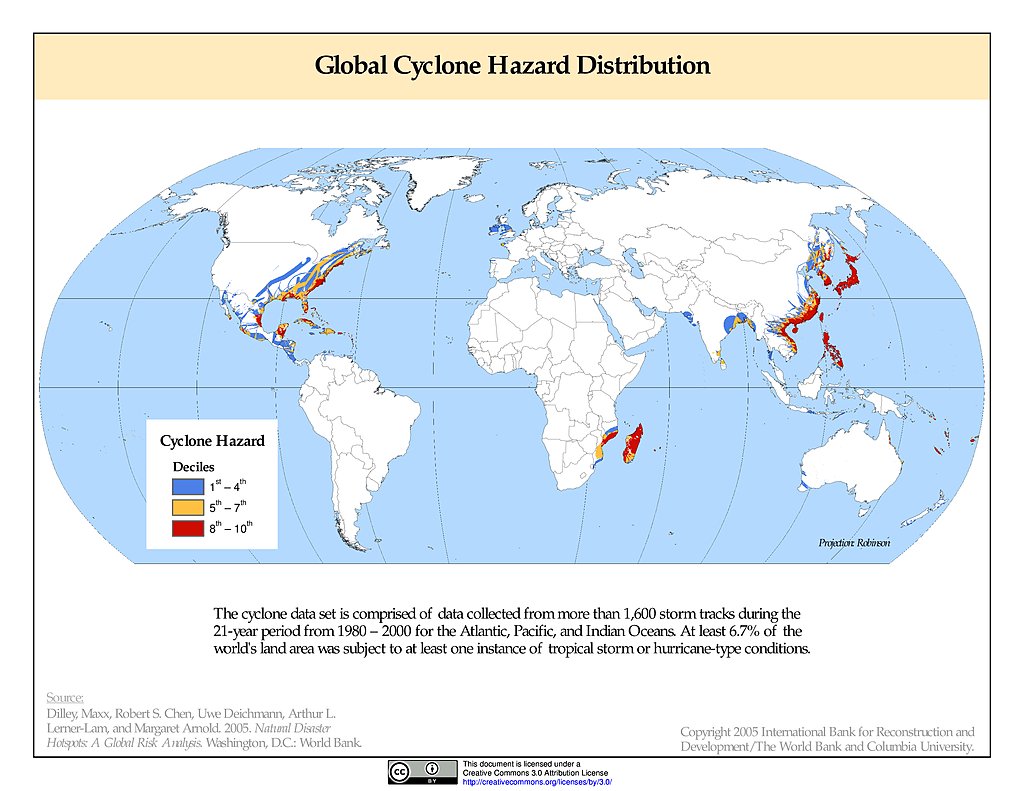
Cyclone Hazard Frequency & Distribution
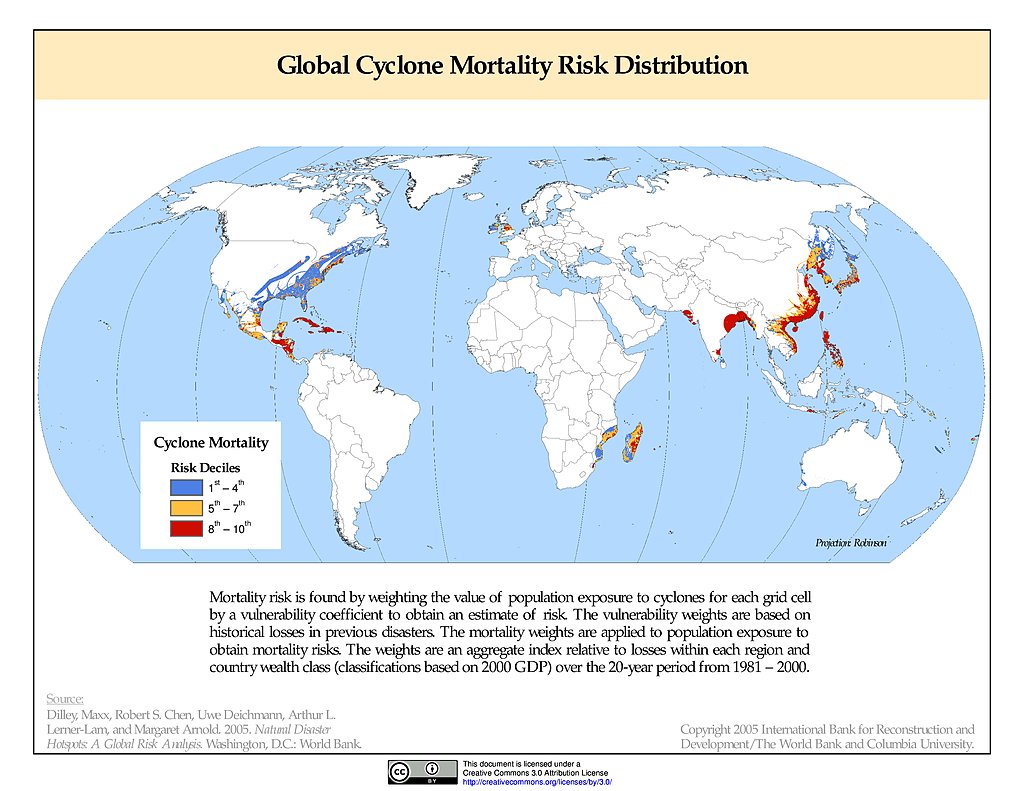
Cyclone Mortality Risks & Distribution
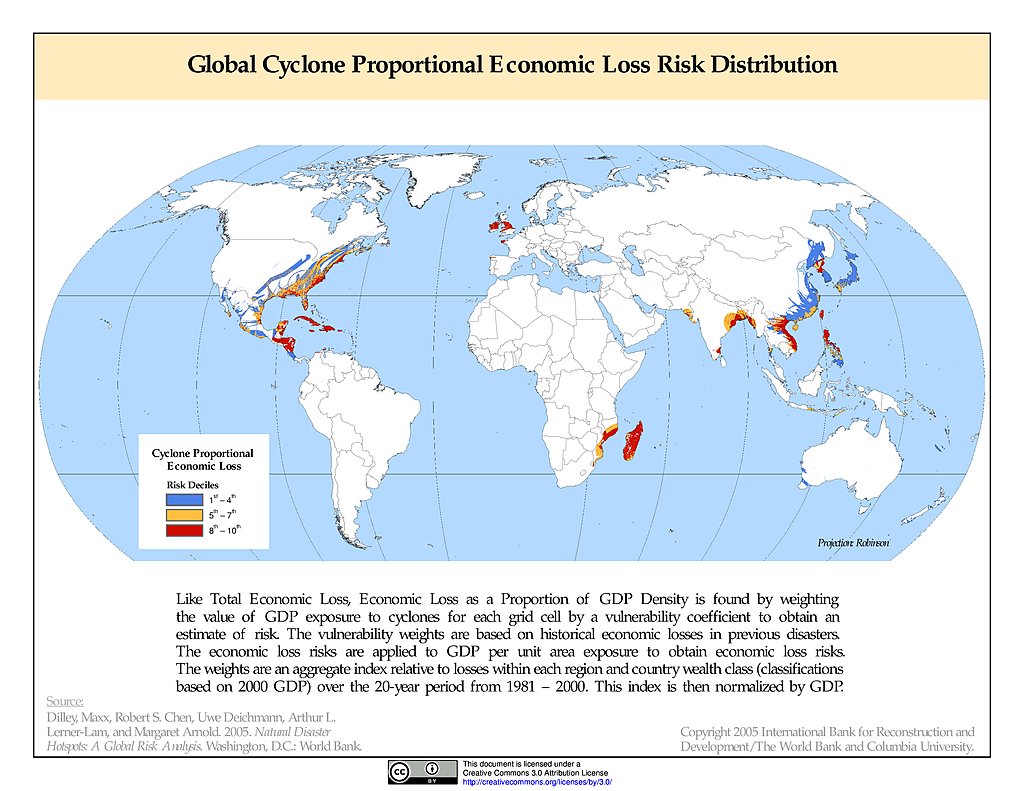
Cyclone Proportional Economic Loss Risk Deciles
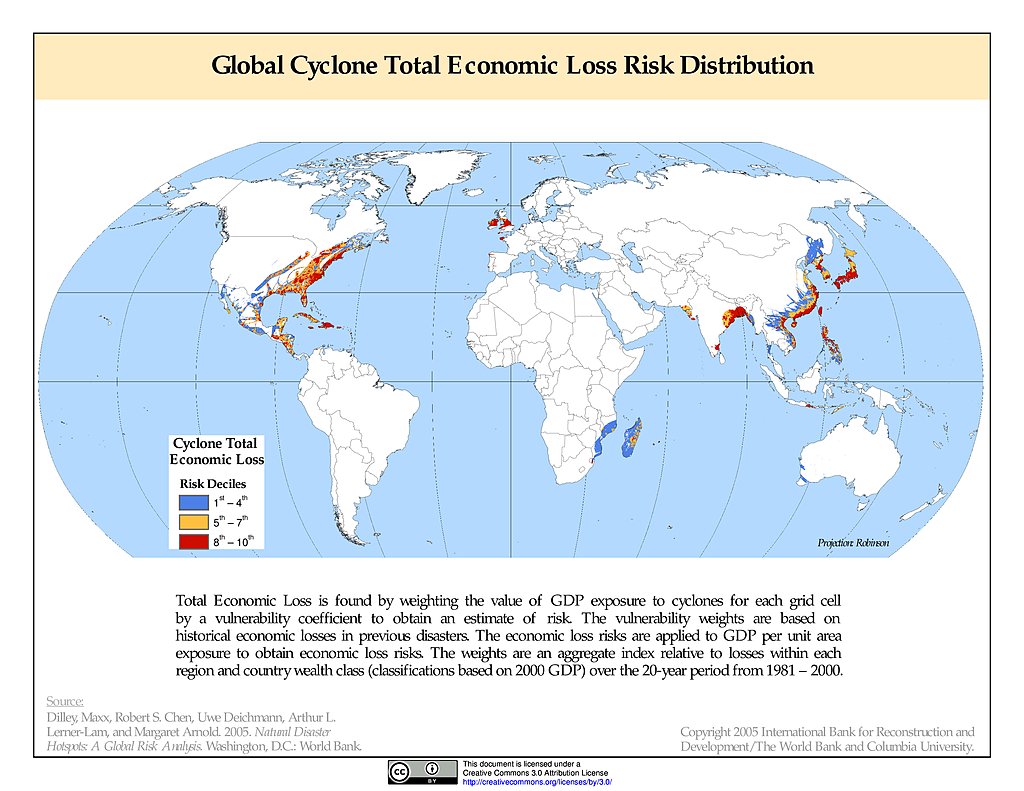
Cyclone Total Economic Loss Risk Deciles
Maps
»
Region: Global
Remove Facet
5 of 18
Prev
|
Next