Air Quality Data for Health-Related Applications
To provide daily and annual PM2.5 concentration data in the U.S. at a resolution of 1-km (about 30 arc-seconds) for public health research to respectively estimate short- and long-term effects on human health, and for other related research.
|
|
Satellite-Derived Environmental Indicators
To provide annual global surface concentrations (micrograms per cubic meter) of all composition ground-level fine particulate matter less than or equal to 2.5 microns in diameter (PM2.5) for large-scale health and environmental research.
|
Air Quality Data for Health-Related Applications
To provide annual PM2.5 component concentration data for the contiguous U.S. at resolutions of 50m in urban areas and 1km in non-urban areas for public health research to estimate effects on human health, and for other related research.
|
|
Air Quality Data for Health-Related Applications
To provide annual PM2.5 component trace elements concentration data for the contiguous U.S. at resolutions of 50m in urban areas and 1km in non-urban areas for public health research to estimate effects on human health, and for other related research.
|
Satellite-Derived Environmental Indicators
To provide an annual global surface of concentrations (micrograms per cubic meter) of all composition ground-level fine particulate matter of 2.5 micrometers or smaller (PM2.5) for large-scale health and environmental research.
|
|
Air Quality Data for Health-Related Applications
To provide a framework of public-health-focused air quality indicators that quantifies country trends in exposure to major air pollutants.
|
Air Quality Data for Health-Related Applications
To provide daily and annual Fine Particulate Matter (PM2.5), Ozone (O3), and Nitrogen Dioxide (NO2) concentrations data at ZIP Codes for the contiguous U.S. for research in environmental epidemiology, environmental justice, and health equity by linking with ZIP Code-level demographic and medical data sets, and for other related research.
|
|
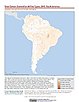
Satellite-Derived Environmental Indicators
To provide an annual global surface of concentrations (micrograms per cubic meter) of mineral dust and sea-salt filtered fine particulate matter of 2.5 micrometers or smaller (PM2.5) in countries and urban areas for large-scale health and environmental research
|
Air Quality Data for Health-Related Applications
To provide daily and annual PM2.5 concentration data in the U.S. at a resolution of 1 km (about 30 arc-seconds) for public health research to respectively estimate short- and long-term effects on human health, and for other related research.
|
|
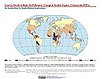
Satellite-Derived Environmental Indicators
To provide data that can be used to calculate trace gas and aerosol emissions, due to fires; monitor and assess national efforts to manage emissions.
|
Satellite-Derived Environmental Indicators
To provide data that can be used to calculate trace gas and aerosol emissions due to fires; monitor and assess national efforts to manage emissions.
|
|
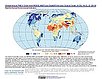
Climate Effects on Food Supply
To provide an assessment of potential climate change impacts on world crop production, including quantitative estimates of yield changes of major food.
|