NASA Website Socioeconomic Data and Applications Center (sedac)
A Data Center in NASA's Earth Observing System Data and Information System (EOSDIS) — Hosted by CIESIN at Columbia University
Data
  • Data Sets
  • Maps
  • Web Pages
  • home
  • Data
    • · Data Sets
    • · Data Collections
    • · Featured Data Uses
    • · Data Citations
    • · Citations Database
    • · Data Submission
  • Maps
    • · Map Gallery
    • · Map Viewer
    • · Map Services
    • · Mapping Tools
  • Themes
    • · Agriculture
    • · Climate
    • · Conservation
    • · Governance
    • · Hazards
    • · Health
    • · Infrastructure
    • · Land Use
    • · Marine and Coastal
    • · Population
    • · Poverty
    • · Remote Sensing
    • · Sustainability
    • · Urban
    • · Water
  • Resources
    • · Guides
    • · Multimedia
    • · Networks
    • · News
    • · Publications
    • · Related Sites
    • · Remote Sensing
    • · Tools
  • Social Media
    • · Twitter
    • · FaceBook
    • · YouTube
    • · Flickr
    • · Blog Posts
    • · Communities
  • About
    • · About SEDAC
    • · User Working Group
    • · Privacy
    • · User Registration
  • Help
 

Climate Impacts, Vulnerability, and Adaptation

Follow Us: Twitter Follow Us on Facebook YouTube Flickr   |   Share: Twitter Facebook
  • Theme Home
  • Data Sets
  • Map Gallery
  • Map Services
  • Featured Data Uses
  • Resources
    • Guides
    • Multimedia
    • Networks
    • News
    • Related Sites
    • Tools

NASA Earthdata Webinar: Using Geospatial Data to Evaluate Climate Hazards

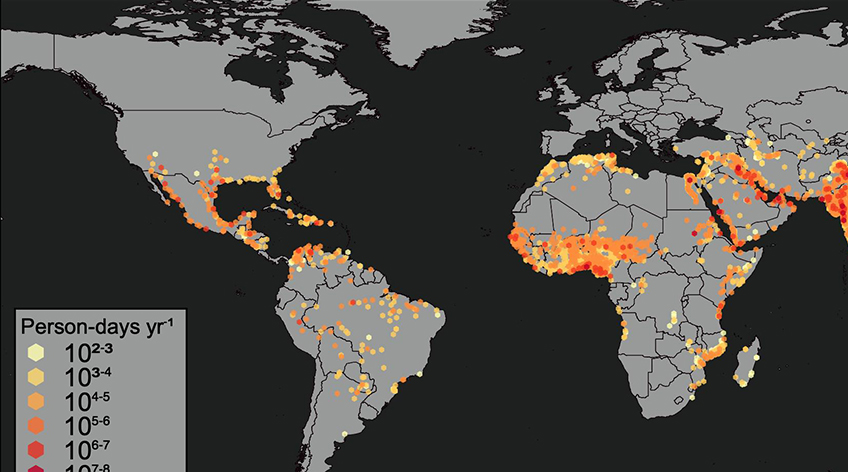
Thumbnail of global map showing annual municipality-level increases in the rate of urban population exposure to extreme heat for the years from 1983 through 2016.

An introduction to the data sets Global High Resolution Daily Extreme Urban Heat Exposure (UHE-Daily), v1 (1983–2016) and U.S. Social Vulnerability Index Grids, v1 (2000, 2010, 2014, 2016, and 2018), released by the NASA Socioeconomic Data and Applications Center (SEDAC). Includes data discovery and data access tutorials in Python and QGIS.

Code Red: Vulnerability to Extreme Heat, Floods, and Displacement

Code Red title card

For NYC Climate Week 2021, a panel comprised of CIESIN researchers highlighted their recent work on mapping extreme heat in urban areas, assessing social vulnerability to flooding, and modeling climate-induced population displacement.

PERN Webinar—Refugee and Internally Displaced Populations, Environmental Impacts, and Climate Risks

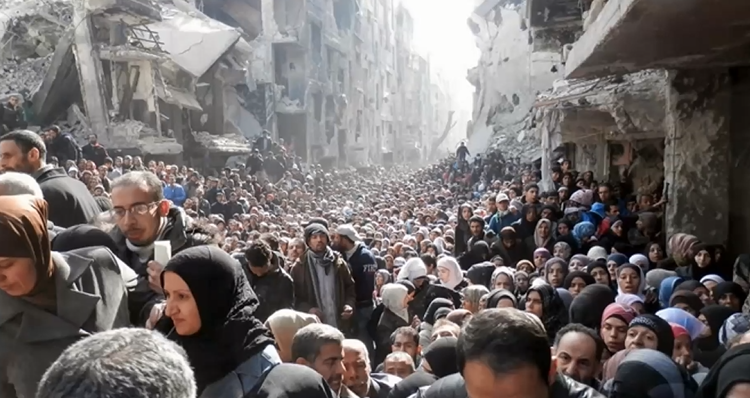
Photo of dense crowd

This Webinar kicked off the cyberseminar held May 10–18, 2021, by the Population and Environment Research Network (PERN), which focused on new perspectives and innovative methodological approaches in geography, remote sensing, economics, disaster studies, and development studies, that shed light on the environmental and climatic challenges faced by global refugees. Organized by Jamon Van Den Hoek and David Wrathall, Oregon State U.; and Susana Adamo and Alex de Sherbinin, CIESIN, Columbia U., and PERN co-coordinators. PERN is a panel of The International Union for the Scientific Study of Population (IUSSP) and a sustained partner of Future Earth. Co-sponsored by GEO Human Planet, technical support by the NASA-funded Socioeconomic Data and Applications Center (SEDAC) at the Center for International Earth Science Information Network of Columbia University.

PERN Webinar: Population, Climate Change, and Food Security

Title Slide for PERN Webinar: Population, Climate Change, and Food Security

This PERN Webinar kicked off the cyberseminar May 18–25, 2021, focusing on analysis of the population-climate change-food security nexus using methodological tools and concepts in demography, geography, economics, systems analysis, and other related fields. It was hosted by the International Institute for Applied Systems Analysis (IIASA) and CGIAR Research Program on Climate Change, Agriculture and Food Security (CCAFS) and organized by IIASA, University of Minnesota, CUNY Baruch, CIESIN-Columbia University, Environmental Science for Social Change), Population Council and Asian Population Research Center, and Escola Nacional de Ciências Estatísticas-ENCE. Learn more at https://populationenvironmentresearch.org/cyberseminars.

Video: Mapping Spatial Patterns of Vulnerability in Mali

Video: Mapping Spatial Patterns of Vulnerability in Mali

Using the results of a climate vulnerability mapping exercise for Mali, West Africa, as an example, this video describes how SEDAC data were integrated with NASA data to produce a decision support tool for the US Agency for International Development (USAID).

Home | Data | Data Uses | Data Citations | Maps | Map Services

News | Tools | Guides | Publications | Blog Posts

About | Help | Privacy | User Registration

Copyright © 1997–2023. The Trustees of Columbia University in the City of New York.

WDS ICSU