Search » Data Sets (47)
|
1 of 3
Prev
|
Next
|
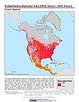
U.S. Climate Risk Projections by County, v1 (
|
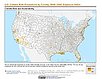
U.S. Social Vulnerability Index Grids, v1.01 (2000, 2010, 2014, 2016, 2018, 2020)U.S. Census Grids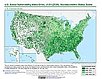
To provide a 1 km grid of the CDC Social Vulnerability Index (SVI) aligned with CIESIN's Gridded Population of the World, Version 4, Revision 11 (GPWv4.11) with a mask for water and no population. |
|
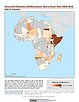
Global Gridded Relative Deprivation Index (GRDI), v1 (
|
Geocoded Disasters (GDIS) Dataset, v1 (
|
|
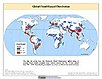
Global Human Modification of Terrestrial Systems, v1 (2016)Land Use and Land Cover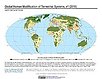
To provide a cumulative measure of human modification of terrestrial lands based on modeling the physical extents of 13 anthropogenic stressors and their estimated impacts using spatially-explicit global data sets. |
Global Development Potential Indices, v1 (2016)Land Use and Land Cover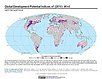
To provide spatially-explicit data that relatively rank global land suitability referred to as Development Potential Indices (DPIs) for 13 sectors related to renewable energy, fossil fuels, mining and agriculture as an aid to conservation priority setting. |
|
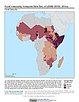
Food Insecurity Hotspots Data Set, v1 (
|
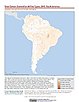
Development Threat Index, v1 (2015)Land Use and Land Cover (LULC)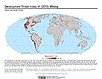
To provide a future development threat map based on combining these resources: agricultural expansion, urban expansion, conventional oil and gas, unconventional oil and gas, coal, mining, biofuels, solar, and wind. |
|
Global Fire Emissions Indicators, Grids, v1 (
|
Global Urban Heat Island (UHI) Data Set, v1 (2013)Satellite-Derived Environmental Indicators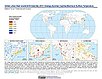
To provide a global data set of average summer daytime maximum/nighttime minimum land surface temperatures (LSTs) for urban extents, as well as the LST difference between the urban area and the buffer. |
|
Global Summer Land Surface Temperature (LST) Grids, v1 (2013)Satellite-Derived Environmental Indicators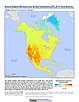
To provide raster representations of global summer daytime maximum and nighttime minimum surface temperature for studies related to human health and climate change. |
Population Exposure Estimates in Proximity to Nuclear Power Plants, Locations, v1 (
|
|
ATSDR Hazardous Waste Site Polygon Data with CIESIN Modifications, v2 (2010)Superfund Site FootprintsTo provide an easily accessible, corrected data set of polygons for hazardous waste sites in the United States which can be used to identify nearby populations and assess their potential risk. |
U.S. EPA National Priorities List Sites with CIESIN Modifications, v2 (2014)Superfund Site Footprints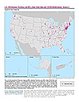
To provide an easily accessible, corrected EPA data set of the geo-referenced locations displayed as points for all the National Priorities List (NPL) Superfund sites in the United States, Puerto Rico, and other territories. |
|
ATSDR Hazardous Waste Site Polygon Data, v2 (2010)Superfund Site FootprintsTo provide the ATSDR polygon data set of hazardous waste sites in the United States, Puerto Rico, and other territories which can be used to identify nearby populations and assess their potential risk. |
Global Flood Hazard Frequency and Distribution, v1 (
|
|
Global Landslide Mortality Risks and Distribution, v1 (2000)Natural Disaster Hotspots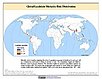
To provide a means of assessing global landslide mortality risks and distribution. |
Global Multihazard Total Economic Loss Risk Deciles, v1 (2000)Natural Disaster Hotspots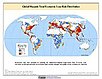
To identify areas of the world that are at greater risk of multihazard total economic loss. |
|
Global Multihazard Frequency and Distribution, v1 (2000)Natural Disaster Hotspots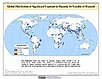
To provide insight into the frequency and distribution of multihazard events. |
Global Cyclone Hazard Frequency and Distribution, v1 (
|
|
1 of 3
Prev
|
Next
|