NASA Website Socioeconomic Data and Applications Center (sedac)
A Data Center in NASA's Earth Observing System Data and Information System (EOSDIS) — Hosted by CIESIN at Columbia University
Data
  • Data Sets
  • Maps
  • Web Pages
  • home
  • Data
    • · Data Sets
    • · Data Collections
    • · Featured Data Uses
    • · Data Citations
    • · Citations Database
    • · Data Submission
  • Maps
    • · Map Gallery
    • · Map Viewer
    • · Map Services
    • · Mapping Tools
  • Themes
    • · Agriculture
    • · Climate
    • · Conservation
    • · Governance
    • · Hazards
    • · Health
    • · Infrastructure
    • · Land Use
    • · Marine and Coastal
    • · Population
    • · Poverty
    • · Remote Sensing
    • · Sustainability
    • · Urban
    • · Water
  • Resources
    • · Guides
    • · Multimedia
    • · Networks
    • · News
    • · Publications
    • · Related Sites
    • · Remote Sensing
    • · Tools
  • Social Media
    • · Twitter
    • · FaceBook
    • · YouTube
    • · Flickr
    • · Blog Posts
    • · Communities
  • About
    • · About SEDAC
    • · User Working Group
    • · Privacy
    • · User Registration
  • Help
 

Hazards and Disaster Risk

Follow Us: Twitter Follow Us on Facebook YouTube Flickr   |   Share: Twitter Facebook
  • Theme Home
  • Data Sets
  • Map Gallery
  • Map Services
  • Featured Data Uses
  • Resources
    • Guides
    • Multimedia
    • Networks
    • News
    • Related Sites

Changing Global Patterns of Urban Exposure to Flood and Drought Hazards

Global Environmental Change – January 15, 2016
Changing Global Patterns of Urban Exposure to Flood and Drought Hazards

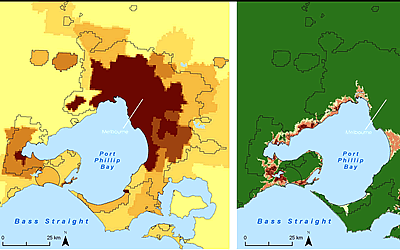
Combining SEDAC’s Low Elevation Coastal Zone (LECZ) data and Natural Disaster Hotspots flood frequency maps with land cover imagery derived from NASA’s MODIS instrument, the researchers who developed SEDAC’s Global Grid of Probabilities of Urban Expansion data set ask how the global and regional patterns of urban growth in the near future will affect urban susceptibility to floods and droughts.  What they found is that the extent of urban areas exposed to floods and drought will generally double by 2030, even without factoring in the potential impacts of climate change.

Turning Schools from Death Traps into Havens

Science Times section of The New York Times – May 27, 2008
Turning Schools from Death Traps into Havens

Map of school-age children in earthquake zones illustrates an accompanying article: following the recent earthquakes in China, experts assess school safety and the vulnerability of children to earthquakes.

Population and Energy Elasticity of Tornado Casualties

Geophysical Research Letters – May 25, 2017

Tornadoes account for about one in five natural hazard-related deaths in the United States.  This recent study investigated the relationships between tornado casualties (injuries and deaths), storm energy, and population using the NASA SEDAC Gridded Population of the World (GPW) v4 data set.  For all tornadoes, investigators found that a doubling of population increased the casualty rate by 21% while a doubling of storm energy increased the casualty rate by 33%.  For the strongest storms casualty rates from increases in population and storm energy were even greater.  These estimates can be used to project future changes in casualties given known population and storm trends.

People Reported Missing via IReport

CNN – February 23, 2010
People Reported Missing via IReport

This interactive map shows the population missing as a result of the Haiti earthquake on January 28, 2010. Thousands of personal reports of loved ones missing were provided to Ireport, and this information was combined with SEDAC population data to create the map.

NASA Data Helps Pinpoint Impacted Populations in Disaster Aftermath

Space & Earth science/Earth Sciences – June 13, 2008
NASA Data Helps Pinpoint Impacted Populations in Disaster Aftermath

A map of Burma, based on the SEDAC Gridded Population of the World (GPW) data product, reveals that coastal areas hit hardest by the cyclone in May 2008 were highly populated. (Areas in progressively darker shades of brown represent increased population.)

Map describing the path of Cyclone Nargis through the Irrawaddy Delta and the populations affected

CNN Video Newscast – May 7, 2008
Map of the The Irrawaddy Delta and Cyclone Nargis

A CNN video newscast refers to a map of the path of Cyclone Nargis and the populations affected, in the worst natural disaster in the recorded history of Burma (Myanmar).

Earthquakes and Aftershocks

CNN – February 23, 2010
Earthquakes and Aftershocks

An interactive map shows impacts from the recent Haiti earthquake.

Earthquake Rocks China

WSJ Online – May 13, 2008
Earthquake Rocks China

Map of China illustrates an article comparing the location of the Sichuan province earthquakes with population centers in China.

Disaster Awaits Cities in Earthquake Zones

The New York Times – February 24, 2010
Disaster Awaits Cities in Earthquake Zones

Data and maps compiled by SEDAC and the Center for Hazards and Risk Research are featured in a front-page news article in the New York Times (print version February 25) assessing the vulnerability of buildings in earthquake zones. “Where Shoddy Construction Could Mean Death” shows a map (top) that depicts the predicted number of deaths in Instanbul from a magnitude 7.5 earthquake, depending on the type of construction of the building. The second map (bottom) ranks the vulnerability of other urban areas in earthquake zones with more than one million people.

Caught in the Danger Zone

The Wall Street Journal – January 13, 2010
CIESIN supplied population density data for a map of the Haiti earthquake.

SEDAC population density data was used in a map of the Haiti earthquake.

Managing Urban Growth and Flood Risk in a Changing Climate/South and Southeast Asia

World Development Report 2010 – March 16, 2010
map of Port Phillip Bay

The SEDAC data set Low-elevation Coastal Zone (LECZ) is the basis for a set of national-level indicators of the total area and population in the LECZ circa 2000. Map 2.2 (page 94), Chapter 2 of the World Development Report 2010, Managing Urban Growth and Flood Risk in a Changing Climate in South and Southeast Asia.  

Home | Data | Data Uses | Data Citations | Maps | Map Services

News | Tools | Guides | Publications | Blog Posts

About | Help | Privacy | User Registration

Copyright © 1997–2023. The Trustees of Columbia University in the City of New York.

WDS ICSU