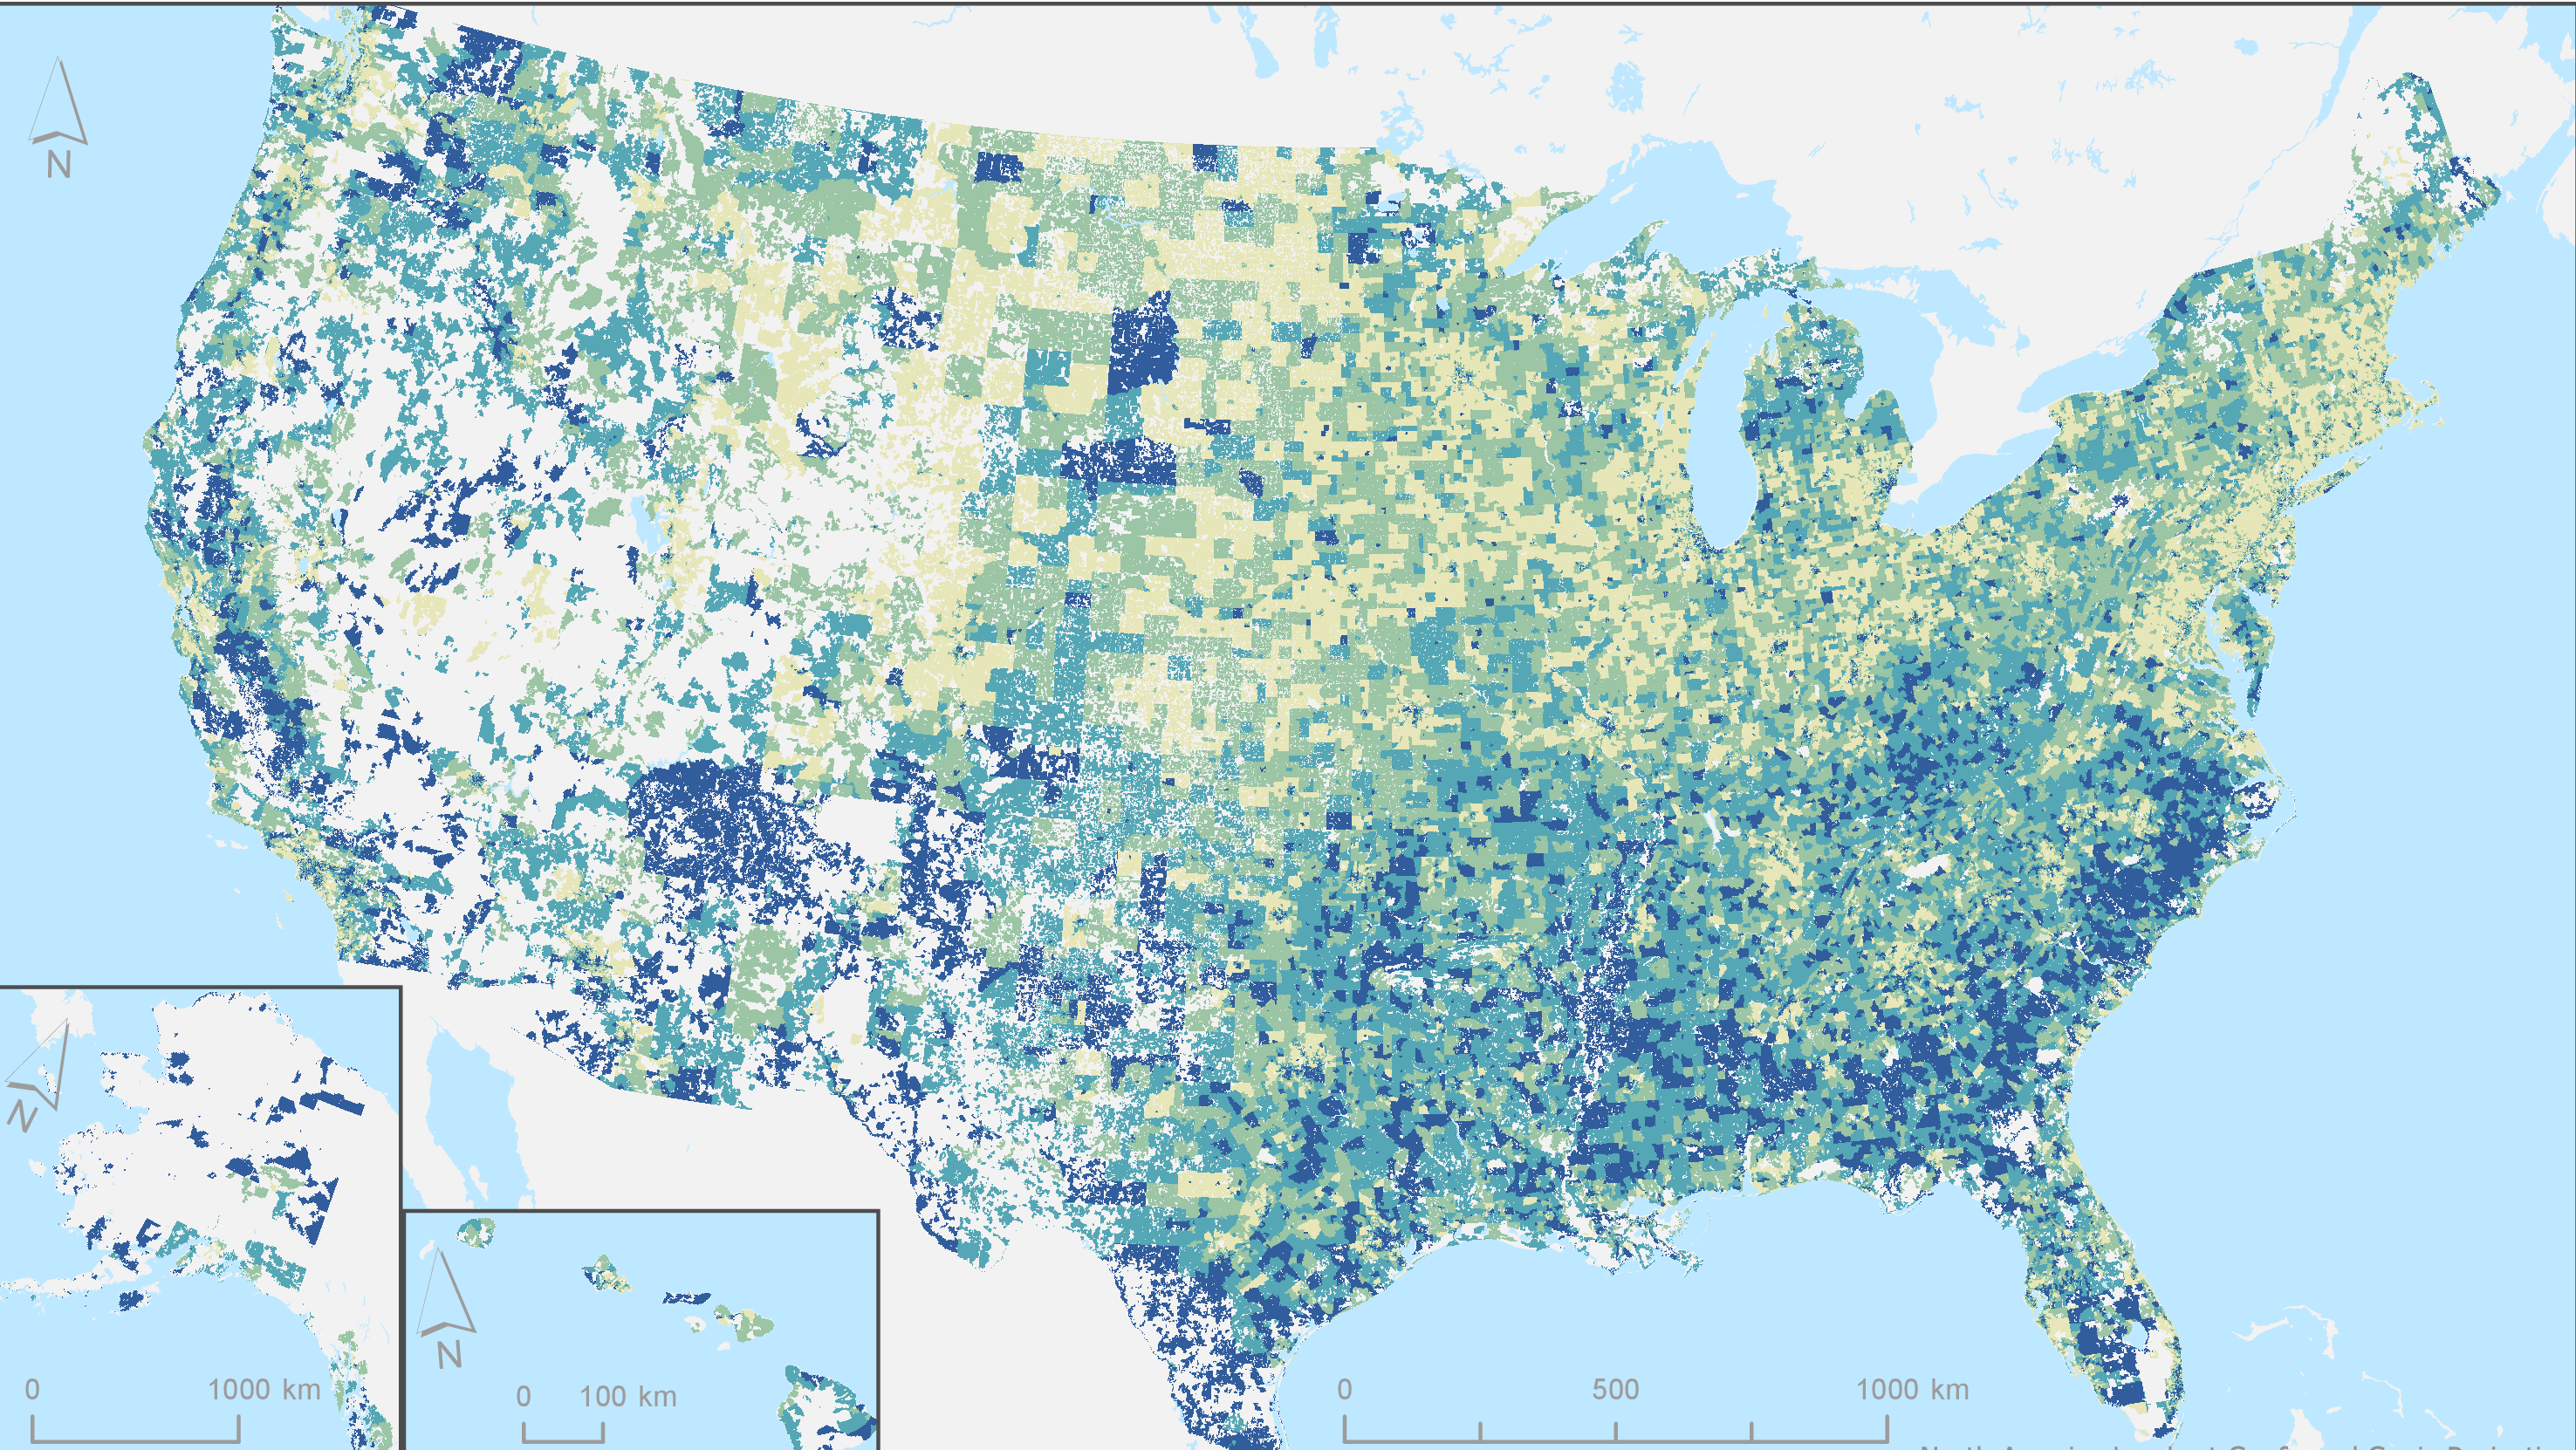
An easy-to-use mapping tool visualizes building footprint data for nearly all New York State’s infrastructure, except New York City. Highly interactive, it requires only Internet access, ensuring that communities with fewer resources can create comprehensive flood scenarios for planning, response, and policymaking.
Hazards and Disaster Risk
Follow Us: Twitter Follow Us on Facebook YouTube Flickr | Share: Twitter FacebookNASA Earthdata Webinar: Data Sets for Health and Air Quality Impacts
An introduction to and analysis of a selection of satellite-derived air quality data sets at both global and US scales, from the NASA Socioeconomic Data and Applications Center (SEDAC). Data sets include GPWv4, Social Vulnerability Grids, and the Global Relative Deprivation Index. Part of NASA′s Earthdata Webinar Series.
NASA Earthdata Webinar: Using Geospatial Data to Evaluate Climate Hazards
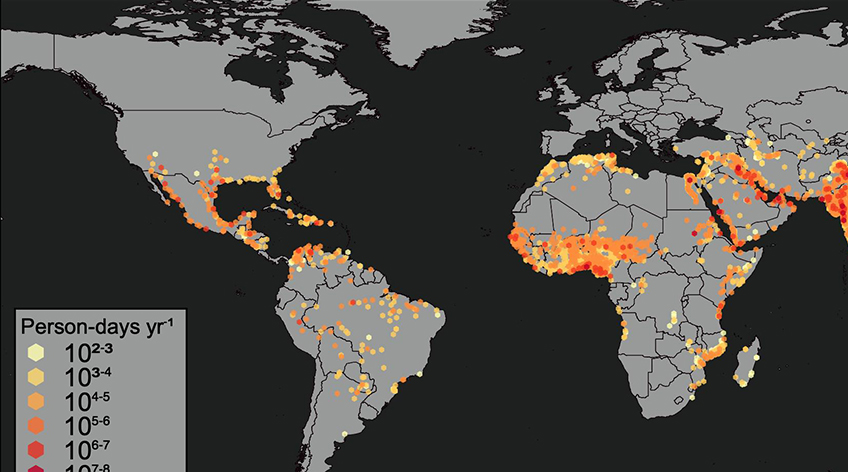
An introduction to the data sets Global High Resolution Daily Extreme Urban Heat Exposure (UHE-Daily), v1 (1983–2016) and U.S. Social Vulnerability Index Grids, v1 (2000, 2010, 2014, 2016, and 2018), released by the NASA Socioeconomic Data and Applications Center (SEDAC). Includes data discovery and data access tutorials in Python and QGIS.
Part One of “Introduction to Population Grids and their Integration with Remote Sensing Data for Sustainable Development and Disaster Management”
Part One of a two-part training by NASA’s Applied Remote Sensing Training Program (ARSET), “Introduction to Population Grids and their Integration with Remote Sensing Data for Sustainable Development and Disaster Management,” held March 30 and April 6, 2021. It was organized by CIESIN research scientist Susana Adamo on behalf of NASA’s Socioeconomic Data and Applications Center (SEDAC) and the POPGRID Data Collaborative. Part One,“Introduction to Population Grids and Their Uses,” introduces the POPGRID Data Collaborative, the origins of gridding, and its evolution to present day application areas in health, humanitarianism, development, and disaster risk reduction. 90-minute recording, Q and A transcript, and presentation slides are available.
Webinar: Rapid Assessment of Hazards—NASA SEDAC Hazard Mapper
A simple, online tool for estimating the population living in proximity to hazardous events as well as human settlements and major facilities such as dams and nuclear power plants. The Hazards Mapper displays near-real-time data on earthquakes, fires, air quality, and, for the U.S., flood and tornado warnings. Part of the monthly NASA Earthdata Webinar Series that highlights NASA EOSDIS data products and data access tools.