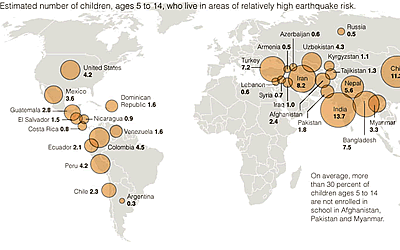
Map of school-age children in earthquake zones illustrates an accompanying article: following the recent earthquakes in China, experts assess school safety and the vulnerability of children to earthquakes.
Map of school-age children in earthquake zones illustrates an accompanying article: following the recent earthquakes in China, experts assess school safety and the vulnerability of children to earthquakes.
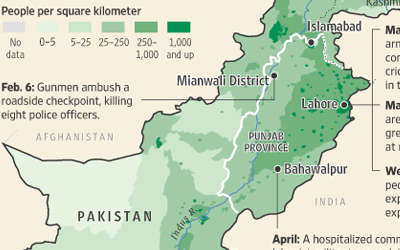
Map of Pakistan illustrating areas of escalating violence in the Punjab, the country’s most populous province.
An embedded Google Earth client in an article in Nature News shows the population count living within 75 kilometers of each of the world′s nuclear power plants. Population increases with circle size and color, from green (< 0.5 million) to red (> 20 million). The data and analysis were developed by SEDAC.

This article in the annual anthology, Sensing Our Planet: NASA Earth Science Research Features 2012, describes how economists have used night-time lights satellite data together with SEDAC human settlements data as a measure of economic growth, complementing traditional economic data. The researchers combined a dataset produced by NOAA’s National Geophysical Data Center from the Defense Meteorological Satellite Program (DMSP) with SEDAC’s Global Rural-Urban Mapping Project version 1 (GRUMPv1) Settlement Points to attribute economic activity to specific cities. The researchers, including former SEDAC staff member Adam Storeygard, show that the night-time lights data enable cross-border and subnational assessments of economic activity.
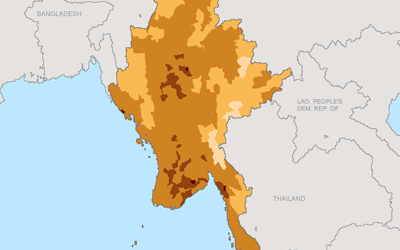
A map of Burma, based on the SEDAC Gridded Population of the World (GPW) data product, reveals that coastal areas hit hardest by the cyclone in May 2008 were highly populated. (Areas in progressively darker shades of brown represent increased population.)
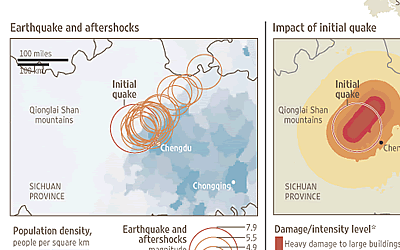
Map of China illustrates an article comparing the location of the Sichuan province earthquakes with population centers in China.
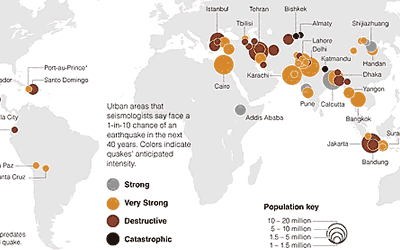
Data and maps compiled by SEDAC and the Center for Hazards and Risk Research are featured in a front-page news article in the New York Times (print version February 25) assessing the vulnerability of buildings in earthquake zones. “Where Shoddy Construction Could Mean Death” shows a map (top) that depicts the predicted number of deaths in Instanbul from a magnitude 7.5 earthquake, depending on the type of construction of the building. The second map (bottom) ranks the vulnerability of other urban areas in earthquake zones with more than one million people.
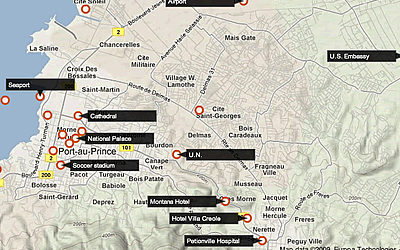
SEDAC population density data was used in a map of the Haiti earthquake.