NASA Website Socioeconomic Data and Applications Center (sedac)
A Data Center in NASA's Earth Observing System Data and Information System (EOSDIS) — Hosted by CIESIN at Columbia University
Data
  • Data Sets
  • Maps
  • Web Pages
  • home
  • Data
    • · Data Sets
    • · Data Collections
    • · Featured Data Uses
    • · Data Citations
    • · Citations Database
    • · Data Submission
  • Maps
    • · Map Gallery
    • · Map Viewer
    • · Map Services
    • · Mapping Tools
  • Themes
    • · Agriculture
    • · Climate
    • · Conservation
    • · Governance
    • · Hazards
    • · Health
    • · Infrastructure
    • · Land Use
    • · Marine and Coastal
    • · Population
    • · Poverty
    • · Remote Sensing
    • · Sustainability
    • · Urban
    • · Water
  • Resources
    • · Guides
    • · Multimedia
    • · Networks
    • · News
    • · Publications
    • · Related Sites
    • · Remote Sensing
    • · Tools
  • Social Media
    • · Twitter
    • · FaceBook
    • · YouTube
    • · Flickr
    • · Blog Posts
    • · Communities
  • About
    • · About SEDAC
    • · User Working Group
    • · Privacy
    • · User Registration
  • Help
 

Population Distribution and Change

Follow Us: Twitter Follow Us on Facebook YouTube Flickr   |   Share: Twitter Facebook
  • Theme Home
  • Data Sets
  • Map Gallery
  • Map Services
  • Featured Data Uses
  • Resources
    • Guides
    • Multimedia
    • Networks
    • News
    • Publications
    • Related Sites
    • Tools

World Resources Report: Decision Making in a Changing Climate

World Resources Institute – November 18, 2011
Bangkok, Thailand - November 4, 2011: Man with his family and dogs overlooking flooded street of Bangkok. Unusual heavy rains in July 2011 combined with high tides of the sea triggered massive flooding in Thailand. Approximately one third of all provinces are affected.

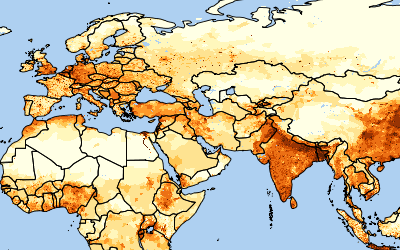
The widely distributed 2010-2011 World Resources Report: Decision Making in a Changing Climate includes coastal population estimates from SEDAC′s Population Landscape and Climate Estimates (PLACE) data collection. The data includes both the percentage of and a country′s actual population living within 10 kilometers of a coastline, and is based on SEDAC′s Global Rural-Urban Mapping Project (GRUMP) population data set.

Water Balance of Global Aquifers Revealed by Groundwater Footprint

Nature – September 8, 2012
Aquifer

Researchers interested in the sustainability of groundwater depletion used SEDAC’s Gridded Population of the World (GPW v3) population count data for 2000 to find that approximately 1.7 billion people inhabit areas impacted by groundwater stress.  More than half the people affected live in China and India.

Turning Schools from Death Traps into Havens

Science Times section of The New York Times – May 27, 2008
Turning Schools from Death Traps into Havens

Map of school-age children in earthquake zones illustrates an accompanying article: following the recent earthquakes in China, experts assess school safety and the vulnerability of children to earthquakes.

Taliban Wages War on Police in Its New Front in Pakistan

The Wall Street Journal – May 28, 2008
Taliban Wages War on Police in Its New Front in Pakistan

Map of Pakistan illustrating areas of escalating violence in the Punjab, the country’s most populous province.

Populations in Proximity to Nuclear Power Plants

Nature News – April 21, 2011
Proximity to nuclear power plants, featured on Nature News web site

An embedded Google Earth client in an article in Nature News shows the population count living within 75 kilometers of each of the world′s nuclear power plants. Population increases with circle size and color, from green (< 0.5 million) to red (> 20 million). The data and analysis were developed by SEDAC.

Spatial disparities within Urban Settlements

The World Development Report 2009 – March 10, 2009
Map of Spatial disparities within Urban Settlements

A typically higher standard of living in urban areas compared to rural ones does not rule out striking disparities within cities. SEDAC data from its Global Poverty Mapping Project is used as the basis for this  map. Map 1.2, illustration for Chapter 1--Density, The World Development Report Online 2009.

People Reported Missing via IReport

CNN – February 23, 2010
People Reported Missing via IReport

This interactive map shows the population missing as a result of the Haiti earthquake on January 28, 2010. Thousands of personal reports of loved ones missing were provided to Ireport, and this information was combined with SEDAC population data to create the map.

NASA Data Helps Pinpoint Impacted Populations in Disaster Aftermath

Space & Earth science/Earth Sciences – June 13, 2008
NASA Data Helps Pinpoint Impacted Populations in Disaster Aftermath

A map of Burma, based on the SEDAC Gridded Population of the World (GPW) data product, reveals that coastal areas hit hardest by the cyclone in May 2008 were highly populated. (Areas in progressively darker shades of brown represent increased population.)

China: Distribution of Chickens, Ducks, and Geese

Agriculture, Ecosystems, and Environment – April 30, 2011
Modelling the Distribution of Chickens, Ducks, and Geese in China

SEDAC′s GPWv3 and GRUMPv1, along with MODIS and SRTM data, are used in a paper, “Modelling the Distribution of Chickens, Ducks, and Geese in China,” by D.J. Prosser et al, appearing in Agriculture, Ecosystems & Environment. Global concerns over the emergence of zoonotic pandemics emphasize the need for high-resolution population distribution mapping and spatial modelling. Because of a lack of livestock population distribution data in China, modeling the distribution of poultry is critical to studying emerging zoonotic pandemics. GRUMP population density and urban extents are predictor variables in the model in this paper.

Mapping Population and Geographic Data

The New Security Beat – September 24, 2009
Mapping Population and Geographic Data - Marc Levy

In this blog for the Center Environmental and Security Program (ECSP), CIESIN deputy director Marc Levy talks with ECSP director Geoff Dabelko about using the Gridded Population of the World (GPW) data product to aid in combining population and geographic data.

Map describing the path of Cyclone Nargis through the Irrawaddy Delta and the populations affected

CNN Video Newscast – May 7, 2008
Map of the The Irrawaddy Delta and Cyclone Nargis

A CNN video newscast refers to a map of the path of Cyclone Nargis and the populations affected, in the worst natural disaster in the recorded history of Burma (Myanmar).

Managing Urban Growth and Flood Risk in a Changing Climate/South and Southeast Asia

World Development Report 2010 – March 16, 2010
map of Port Phillip Bay

The SEDAC data set Low-elevation Coastal Zone (LECZ) is the basis for a set of national-level indicators of the total area and population in the LECZ circa 2000. Map 2.2 (page 94), Chapter 2 of the World Development Report 2010, Managing Urban Growth and Flood Risk in a Changing Climate in South and Southeast Asia.  

Beyond Seven Billion

Los Angeles Times – July 23, 2012
A five-part article examines the implications of world population growth beyond seven billion; SEDAC's Human Footprint data shows where Earth been most impacted.Beyond 7 Billion feature image showing chinese people crowded on an escalator

A five-part article examines the implications of world population growth beyond seven billion; SEDAC's Human Footprint data shows where Earth been most impacted.

Global Forecasts of Urban Expansion to 2030

Proceedings of the National Academy of Sciences – February 23, 2013
Phoenix Sprawl

The growth of urban areas has long been considered a local issue, but scientists using SEDAC’s Global Rural-Urban Mapping Project (GRUMP v1) and NASA’s Moderate Resolution Imaging Spectroradiometer (MODIS) land cover product have made spatially explicit forecasts of urban land-cover change to show that biodiversity hotspots and carbon pools will be significantly affected by urban population growth.  The researchers estimate that by 2030, urban land area around the globe will nearly triple the level in year 2000, resulting in substantial loss of habitats in key biodiversity hotspots.

Gridded Population of the World Version 3

National Geographic – May 19, 2011
A map of the Gridded Population of the World Version 3

A map using SEDAC′s Gridded Population of the World data set to illustrate a discussion of population density and population growth, page 50 of the National Geographic Visual Atlas of the World (2009).

Earthquake Rocks China

WSJ Online – May 13, 2008
Earthquake Rocks China

Map of China illustrates an article comparing the location of the Sichuan province earthquakes with population centers in China.

Disaster Awaits Cities in Earthquake Zones

The New York Times – February 24, 2010
Disaster Awaits Cities in Earthquake Zones

Data and maps compiled by SEDAC and the Center for Hazards and Risk Research are featured in a front-page news article in the New York Times (print version February 25) assessing the vulnerability of buildings in earthquake zones. “Where Shoddy Construction Could Mean Death” shows a map (top) that depicts the predicted number of deaths in Instanbul from a magnitude 7.5 earthquake, depending on the type of construction of the building. The second map (bottom) ranks the vulnerability of other urban areas in earthquake zones with more than one million people.

Caught in the Danger Zone

The Wall Street Journal – January 13, 2010
CIESIN supplied population density data for a map of the Haiti earthquake.

SEDAC population density data was used in a map of the Haiti earthquake.

We are Seven Billion

Nature Climate Change – October 3, 2011
image of a crowd of people

A Nature Climate Change article focuses on the milestone of world population passing the seven billion mark and the implications for climate change mitigation and adaptation. Maps featuring SEDAC’s GRUMP data set, describing populations at risk of climate change impacts, are featured on Page 3. The article also features interviews with former SEDAC project scientist Deborah Balk and SEDAC deputy manager Alex de Sherbinin. 

Scorecard on the Environment

NASA Earth Data Web Site – December 1, 2007
Scorecard on the Environment

Sensing Our Planet: NASA Earth Science Research Features 2008 features an article on how SEDAC data was used for the 2008 Environmental Performance Index and other environmental assessments; CIESIN’s Marc Levy is interviewed.

Population and Energy Elasticity of Tornado Casualties

Geophysical Research Letters – May 25, 2017

Tornadoes account for about one in five natural hazard-related deaths in the United States.  This recent study investigated the relationships between tornado casualties (injuries and deaths), storm energy, and population using the NASA SEDAC Gridded Population of the World (GPW) v4 data set.  For all tornadoes, investigators found that a doubling of population increased the casualty rate by 21% while a doubling of storm energy increased the casualty rate by 33%.  For the strongest storms casualty rates from increases in population and storm energy were even greater.  These estimates can be used to project future changes in casualties given known population and storm trends.

Mapping Sub-Saharan Agroecological and Socioeconomic Trends

HarvestChoice Mappr – May 1, 2017

SEDAC's Global Rural-Urban Mapping Project (GRUMP) v1 population and urban extent data are used in the International Food Policy Research Institute (IFPRI) interactive mapping application for Sub-Saharan Africa.  The application, known as Mappr, is built on IFPRI’s HarvestChoice geospatial database of biophysical and socioeconomic indicators covering four broad research domains: agriculture, agroecology, demographics and markets.  Mappr serves as the core to a decision-support system enabling people to visualize relationships between major agroecological challenges, like soil and land degradation, and socioeconomic trends such as poverty, health and nutrition.

Africa Human Footprint Map

National Geographic – May 19, 2011
National Geographic Africa Human Footprint

A map of SEDAC′s the Human Footprint illustrates the extent to which Africa′s land area is influenced by humans.

Earthquakes and Aftershocks

CNN – February 23, 2010
Earthquakes and Aftershocks

An interactive map shows impacts from the recent Haiti earthquake.

Decline of Forest Elephants in Central Africa

PLoS ONE – June 21, 2013
Elephnat Declines

A recent survey of African forest elephants has revealed a startling reduction in that animal's population and geographic range over the past decade.  Human population density, as measured by SEDAC's Gridded Population of the World (GPW v3) data set, and nearness to human infrastructure, as indicated by SEDAC's Human Influence Index (HII v2), are two of the strongest predictors of that decline along with hunting intensity, poor governance and absence of law enforcement.

Another Way to Look at an Air Quality Problem

State of the Planet – March 7, 2012
Satellite image of a particularly valuable perspective on PM2

Satellite data offer a particularly valuable perspective on PM2—small particles deriving mostly from burning fossil fuels and biomass, which can harm human health—because ground instruments may be unavailable or offer limited information, as is the case in China. With that in mind, researchers at Columbia University’s Earth Institute and Batelle Memorial Institute have developed maps based on satellite data that depict annual PM2.5 exposure in all of China’s provinces.

Geo Quiz

PRI’s The World – June 10, 2009
Geo Quiz

The report on linkages between climate and migration, In Search of Shelter, is featured in a daily geography quiz of the public radio program, PRI’s The World.

Home | Data | Data Uses | Data Citations | Maps | Map Services

News | Tools | Guides | Publications | Blog Posts

About | Help | Privacy | User Registration

Copyright © 1997–2023. The Trustees of Columbia University in the City of New York.

WDS ICSU