|
| African Shifts: Addressing Climate-Forced Migration |
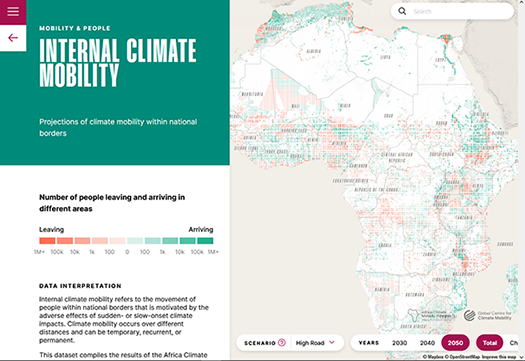
A new report from the Africa Climate Mobility Initiative (ACMI), African Shifts: Addressing Climate-Forced Migration depicts African people’s experience of climate vulnerability and presents possible scenarios for movements due to climate impacts on the continent between now and 2050. Finally, it presents eight key recommendations to be implemented between now and 2030 that focus on constructive, adaptive responses to climate mobility, in alignment with the 2030 Sustainable Development Goals and the Paris Agreement.
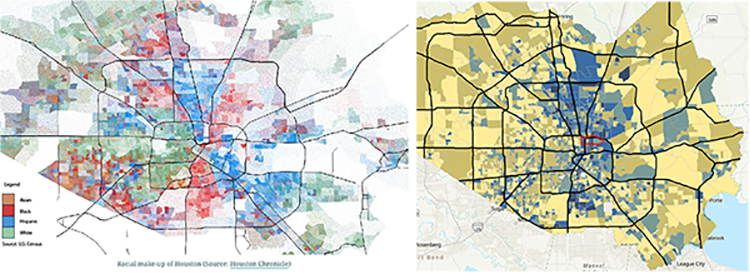
CIESIN contributed to the report by producing spatially explicit projections of both internal and international mobility that may occur from climate impacts, within and among African countries, up to the year 2050. This modelling builds on the innovative approaches of the World Bank’s Groundswell series of reports, for which CIESIN worked with City University of New York and the Potsdam Institute for Climate Impact Research on the modeling. The modeling work was complemented with findings from field research conducted by the Mixed Migration Centre.
The ACMI is a joint undertaking between the African Union Commission, the United Nations Development Programme (UNDP), the UN Framework Convention on Climate Change (UNFCCC), the International Organization for Migration (IOM), and the World Bank. The CIESIN team was led by Alex de Sherbinin, deputy director and senior research scientist, and included Fabien Cottier, postdoctoral research scientist; Susana Adamo, research scientist; Briar Mills, former geographic information specialist; Greg Yetman, associate director for Geospatial Applications; Tricia Chai-Onn, senior geographic information specialist; and John Squires, geographic information specialist.