remote
|
1 of 3
Prev
|
Next
|
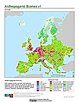
Anthropogenic Biomes of the World, v2 (1700)Anthropogenic BiomesTo provide information on anthropogenic transformation of the biosphere circa 1700 for global land use studies and research on human-environment interactions. |
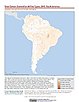
Croplands, v1 (2000)Global Agricultural Lands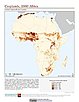
To provide data on the extent of croplands for research on human-environment interactions. |
|
Annual PM2.5 Concentrations for Countries and Urban Areas, v1 (
|
Anthropogenic Biomes of the World, v2 (1800)Anthropogenic BiomesTo provide information on anthropogenic transformation of the biosphere circa 1800 for global land use studies and research on human-environment interactions. |
|
Anthropogenic Biomes of the World, v2 (2000)Anthropogenic BiomesTo provide information on anthropogenic transformation of the biosphere circa 2000 for global land use studies and research on human-environment interactions. |
Global (GL) Annual PM2.5 Grids from MODIS, MISR and SeaWiFS Aerosol Optical Depth (AOD), v4.03 (
|
|
VIIRS Plus DMSP Change in Lights (VIIRS+DMSP dLIGHT), v1 (1992, 2002, 2013)Satellite-Derived Environmental Indicators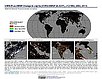
To visualize changes in brightness and extent of global nighttime lights networks over two decades with improved radiometric accuracy and finer spatial resolution. |
Pastures, v1 (2000)Global Agricultural Lands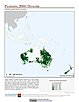
To provide data on the extent of pasturelands for research on human-environment interactions. |
|
Development Threat Index, v1 (2015)Land Use and Land Cover (LULC)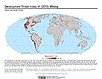
To provide a future development threat map based on combining these resources: agricultural expansion, urban expansion, conventional oil and gas, unconventional oil and gas, coal, mining, biofuels, solar, and wind. |
||
Anthropogenic Biomes of the World, v2 (1900)Anthropogenic BiomesTo provide information on anthropogenic transformation of the biosphere circa 1900 for global land use studies and research on human-environment interactions. |
||
Global Urban Heat Island (UHI) Data Set, v1 (2013)Satellite-Derived Environmental Indicators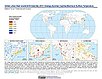
To provide a global data set of average summer daytime maximum/nighttime minimum land surface temperatures (LSTs) for urban extents, as well as the LST difference between the urban area and the buffer. |
Global Fire Emissions Indicators, Grids, v1 (
|
|
Global High Resolution Daily Extreme Urban Heat Exposure (UHE-Daily), v1 (
|
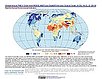
Global Summer Land Surface Temperature (LST) Grids, v1 (2013)Satellite-Derived Environmental Indicators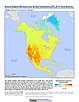
To provide raster representations of global summer daytime maximum and nighttime minimum surface temperature for studies related to human health and climate change. |
|
Global Human Modification of Terrestrial Systems, v1 (2016)Land Use and Land Cover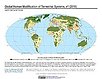
To provide a cumulative measure of human modification of terrestrial lands based on modeling the physical extents of 13 anthropogenic stressors and their estimated impacts using spatially-explicit global data sets. |
Global Development Potential Indices, v1 (2016)Land Use and Land Cover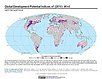
To provide spatially-explicit data that relatively rank global land suitability referred to as Development Potential Indices (DPIs) for 13 sectors related to renewable energy, fossil fuels, mining and agriculture as an aid to conservation priority setting. |
|
Global Patterns in Net Primary Productivity, v1 (1995)Human Appropriation of Net Primary Productivity (HANPP)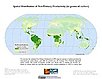
To be utilized in conjunction with a data set of human appropriation of net primary productivity (HANPP) in order to understand global energy flows and localized impacts on the environment. |
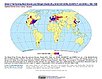
HANPP as a Percentage of Net Primary Productivity, v1 (1995)Human Appropriation of Net Primary Productivity (HANPP)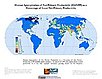
To identify spatial variations in the amount of NPP consumption relative to local production in a way that highlight humanity's growing impact on the biosphere. |
|
1 of 3
Prev
|
Next
|