NASA Website Socioeconomic Data and Applications Center (sedac)
A Data Center in NASA's Earth Observing System Data and Information System (EOSDIS) — Hosted by CIESIN at Columbia University
Data
  • Data Sets
  • Maps
  • Web Pages
  • home
  • Data
    • · Data Sets
    • · Data Collections
    • · Featured Data Uses
    • · Data Citations
    • · Citations Database
    • · Data Submission
  • Maps
    • · Map Gallery
    • · Map Viewer
    • · Map Services
    • · Mapping Tools
  • Themes
    • · Agriculture
    • · Climate
    • · Conservation
    • · Governance
    • · Hazards
    • · Health
    • · Infrastructure
    • · Land Use
    • · Marine and Coastal
    • · Population
    • · Poverty
    • · Remote Sensing
    • · Sustainability
    • · Urban
    • · Water
  • Resources
    • · Guides
    • · Multimedia
    • · Networks
    • · News
    • · Publications
    • · Related Sites
    • · Remote Sensing
    • · Tools
  • Social Media
    • · Twitter
    • · FaceBook
    • · YouTube
    • · Flickr
    • · Blog Posts
    • · Communities
  • About
    • · About SEDAC
    • · User Working Group
    • · Privacy
    • · User Registration
  • Help
 

s

Follow Us: Twitter Follow Us on Facebook YouTube Flickr   |   Share: Twitter Facebook
  • Theme Home
  • Data Sets
  • Map Gallery
  • Map Services
  • Featured Data Uses
  • Resources
    • Guides
    • Multimedia
    • Networks
    • News
    • Publications
    • Related Sites
    • Remote Sensing
    • Tools
1 of 5
Prev | Next
 

User Alert: NASA Earthdata Website Unification - SEDAC's Website is Moving

October 16, 2024

In response to requirements outlined in the 21st Century Integrated Digital Experience Act, NASA’s Earth Science Data Systems (ESDS) program launched the Web Unification Project to migrate all ESDS-funded web properties to earthdata.nasa.gov by the end of 2026. The NASA SEDAC migration to the Earthdata website begins in October 2024  With these changes, not only will the interface you use to access SEDAC datasets, services, and tools change, but the paths for finding information will also change.  To view the new website’s  navigation options and learn how to get support during this transition, view the recent webinar: “Web Unification: Optimizing Your Access to NASA Earth Science Data”. 

Please contact us for more information or questions.

CIESIN Author Wins Population Association of America Poster Award

April 25, 2024
Photo of CIESIN's Susana Adamo, co-author Sara Curran and lead author Courtney Allen next to their Population Association of America poster

Susana Adamo (left) is co-author of an award winning poster on "Aging Populations and Subsequent Tree Cover Expansion, an Investigation in 139 Low- and Middle-Income Countries", presented by Courtney Allen (right) (University of Washington) at the 2024 Meeting of the Population Association of America, held 17-20 April in Columbus, Ohio. The poster was one of five PAA Poster Winners of the session on Neighborhoods, Environment, Spatial Demography, and Data and Methods, which included 98 posters. Co-author Sara Curran (center) (University of Washington) is a former member of SEDAC's User Working Group. Other co-authors of the poster include: Jeff Vincent (Duke University), Kaichao Chang (Duke University, and University of Maryland), and Yi Wang (Duke University and ETH Zurich).

Open Science Workshop Explores Human-Environment Interactions

March 27, 2024
Photo of attendees at the January 2024 Open Science workshop hosted by SEDAC

NASA's Socioeconomic Data and Applications Center (SEDAC), in collaboration with NASA's Transform to Open Science (TOPS) initiative, hosted an open science workshop for the community researching human-environment interactions. Held at the Lamont Campus of Columbia University on January 9, 2024, the workshop brought together 65 scientists from many disciplines with an interest in how to apply open science approaches to the highly interdisciplinary study of the human aspects of global environmental change. Open science is a movement that includes producing open data, using open-source software tools, publishing computer code openly, and publishing research in open access journals.

Presenters showcased work on topics ranging from climate impacts on demographic processes, the integration of field data with remote sensing data, and the collaborative development of a fully open administrative boundaries dataset (which is a prerequisite to data integration across the Earth and social sciences).   

Key challenges identified in the workshop were limitations in financial and human resources, data accessibility and interoperability, the appetite for learning new practices, the willingness to share imperfect or poorly documented code and datasets, and concerns over sensitive information. Open science is not always the least expensive path to generating new knowledge, so it could reinforce existing inequalities in lower-resource settings. 

Important workshop takeaways include the need for sustaining open science funding and democratizing its initiatives, establishing initiative governance, reducing barriers to adoption, ensuring inclusivity, and addressing ethical considerations. 

Participants suggested that the next iteration of the SEDAC Open Science workshop should focus on putting open science data to work by involving more front-line stakeholders and decision-makers, possibly with a focus on low-income countries. There may also be potential for a workshop collaborating with U.S.-based end users of data, including public and private sector decision-makers, to better document and understand how open science principles and approaches can improve decision-making. 

The workshop was organized by SEDAC Assistant Systems Engineer Kytt MacManus, SEDAC Manager Dr. Alex de Sherbinin, and SEDAC Senior Staff Associate Antoinette Wannebo. 

See:
  • The workshop report, a video of the workshop, and all presentations are openly available on Zenodo
  • Earthdata: Open Science Workshop Explores Human-Environment Interactions

CIESIN Welcomes New Associate Director for Science Applications

October 20, 2023
Headshot of CIESIN Associate Director of Science Applications Dana Thomson

CIESIN is pleased to announce the arrival of Dr. Dana Thomson, a prominent public health and spatial data expert who has worked at the intersection of demography, public health, and geography for two decades. Dr. Thomson’s work is characterized by open data, user-centered design, equitable partnerships that address historical inequities, and co-design of meaningful information. She will manage the CIESIN Science Applications division, which advances interdisciplinary research and applications on human-environment interactions, bringing to bear state-of-the-art scientific data and knowledge on pressing sustainable development challenges.

Dr. Thomson helped to establish the Integrated Deprived Area Mapping System (IDEAMAPS) Network which brings together experts from traditionally-siloed “slum” mapping communities including community members, government officials, humanitarians, and data scientists. Several projects within the IDEAMAPS Network are building the infrastructure and processes necessary for “slum” residents and local experts to access the data they need in appropriate formats and validate modelled outputs (maps) in areas they are familiar with, and for modelers to access a validation data layer to improve future iterations of models.

Dana is also a pioneer in the field of gridded population sampling, developing innovative tools and sampling approaches to more accurately measure populations in data-scarce settings, especially vulnerable and mobile populations who are poorly captured by traditional data collection methods. She developed GridSample.org and other tools that help survey experts without Geographic Information System (GIS) skills to create sample frames from gridded population data, and recently published the go-to manual on Designing and Implementing Gridded Population Surveys.

Dana holds a BA in Geography from the George Washington University, an MSc in Global Public Health from the Harvard School of Public Health, and an MSc and PhD in Social Statistics from the University of Southampton (UK). Her research has evaluated the accuracy of gridded population estimates and feasibility of their use for fieldwork in lower- and middle-income countries, and includes several large-scale evaluations of health systems in Africa, Asia, and the Caribbean using geospatial and household survey data. She has also taught practitioners and applied researchers at Harvard University, the University of Rwanda, and the University of Southampton, and worked with AmeriCorps, the Brookings Institution, Johns Snow Inc., the Measure DHS Project, and the World Bank. She has published 48 peer-reviewed articles in journals such as Land Use Policy, PLoS One, Urban Science and the International Journal of Health Geography.

New Mapper for New York State Expands Access to Flood Planning

July 7, 2023
A zoomed-in area of Newburgh, New York, in the lower Hudson River Valley, shows  infrastructure along the river, vulnerable to flooding. Source: NYS FIDSS Mapper

An easy-to-use mapping tool increases flood planning capacity in New York State, especially for historically underrepresented communities, and can enhance planning for sea level rise. Developed by the NASA Socioeconomic Data and Applications Center (SEDAC) at Columbia Climate School’s CIESIN, the New York State Flood Impact Support System Application (NYS FIDSS) visualizes building footprint data for nearly all New York State’s infrastructure, except New York City. It is highly interactive and accessible, requiring only Internet access, ensuring that communities with fewer resources can create comprehensive flood scenarios for planning, response, and policymaking.

The easy interface of the NYS FIDSS mapper aligns with the aims of the new NASA Open Science initiative to more openly share software, data, and knowledge to advance inclusiveness and improve social justice. The Mapper includes a data set, U.S. Social Vulnerability Index Grids, developed by the NASA SEDAC and based on the Centers for Disease Control’s Social Vulnerability Index, which lets users visualize relative “social vulnerability” for areas impacted by flooding. The index displays fine-grained information on social conditions of the population in a particular area, including economic level, who is in the household, minority status, dwelling places, the ability to understand English, and access to transport. This information can be critical to targeting flood planning resources and aid to the areas that most need it—before, during, or after a flood event.

The NYS FIDSS mapper is based on results from the project New York State Building Footprints with Flood Analysis, which provides infrastructure data for all New York State counties excluding New York City. It also includes data on areas bordering the lower Hudson River Valley and Westchester's Long Island Sound shoreline, from the Hudson River Flood Impact Decision Support System, a flood assessment mapping tool developed by CIESIN under support from NYSERDA. The mapper also provides infrastructure, flooding, and socioeconomic data layers at the local level from the Consortium for Climate Risk in the Urban Northeast (CCRUN), whose members from academia, including CIESIN, conducted stakeholder-driven research to reduce climate vulnerability in the urban northeastern United States, supported by NOAA.

The lead developers are CIESIN senior research staff assistant Juan Martinez and senior systems analyst/GIS developer Kytt MacManus. 

See:
  • The New York State Flood Impact Support System Application (NYS FIDSS) Mapping Tool

A New Report Posits Potential Mobility in Africa from Climate Impacts

February 7, 2023
screenshot of (left) text describing internal climate mobility in African countries and (right) map of Africa depicting areas of mobility
African Shifts: Addressing Climate-Forced Migration

A new report from the Africa Climate Mobility Initiative (ACMI), African Shifts: Addressing Climate-Forced Migration depicts African people’s experience of climate vulnerability and presents possible scenarios for movements due to climate impacts on the continent between now and 2050. Finally, it presents eight key recommendations to be implemented between now and 2030 that focus on constructive, adaptive responses to climate mobility, in alignment with the 2030 Sustainable Development Goals and the Paris Agreement.

CIESIN contributed to the report by producing spatially explicit projections of both internal and international mobility that may occur from climate impacts, within and among African countries, up to the year 2050. This modelling builds on the innovative approaches of the World Bank’s Groundswell series of reports, for which CIESIN worked with City University of New York and the Potsdam Institute for Climate Impact Research on the modeling. The modeling work was complemented with findings from field research conducted by the Mixed Migration Centre.  

The ACMI is a joint undertaking between the African Union Commission, the United Nations Development Programme (UNDP), the UN Framework Convention on Climate Change (UNFCCC), the International Organization for Migration (IOM), and the World Bank. The CIESIN team was led by Alex de Sherbinin, deputy director and senior research scientist, and included Fabien Cottier, postdoctoral research scientist; Susana Adamo, research scientist; Briar Mills, former geographic information specialist; Greg Yetman, associate director for Geospatial Applications; Tricia Chai-Onn, senior geographic information specialist; and John Squires, geographic information specialist.

See:
  • Report (19 MB PDF)
  • Interactive Web site, “Voices from the Frontlines″

New SEDAC Data Releases Include First-Ever Global Poverty Grid

January 4, 2023
Gridded map of the world with callouts: State of Mexico, Mexico; Nairobi; and Colombo, LKA
CIESIN-Columbia University

Several new data products have been released under CIESIN’s NASA-funded Socioeconomic Data and Applications Center (SEDAC). Foremost among them, the Global Gridded Relative Deprivation Index (GRDI) measures relative poverty and deprivation using subnational data on human development, infant mortality, and child dependency, as well as satellite-derived data on built-up areas, nighttime lights, and change in nighttime lights. It is the first product of its kind that covers the entire world at a 1 kilometer spatial resolution. Other new data sets from the NASA SEDAC include:

—Daily and Annual Air Quality Data Sets for the Contiguous U.S. support research in environmental epidemiology, environmental justice, and health equity by linking with ZIP Code-level demographic and medical data sets.

—Country Trends in Major Air Pollutants, a framework of public-health-focused air quality indicators that measures more than 200 countries' trends in exposure to particulate matter (PM2.5), ozone (O3), nitrogen oxides (NOx), sulfur dioxide (SO2), carbon monoxide (CO), and volatile organic compounds (VOCs). Developed by an interdisciplinary team from Yale University with NASA SEDAC.

—Urban and Land Backscatter Time Series. Based on satellite microwave backscatter, the data set traces trends in urban settlements from 1993 to 2020. Developed by a team led by Steve Frolking, University of New Hampshire.

—Twentieth Century Crop Statistics, a crop yield data set spanning the period 1900‒2017 provides national and subnational data on production, yield, and harvested area of maize and wheat for many of the world’s major bread baskets. Developed by W. Anderson and others.

—Water Security Monthly Grids. Monthly surpluses and deficits of freshwater, computed on a 0.25 degree grid for 1948‒2014. Developed with ISciences.

See:
  • Global Gridded Relative Deprivation Index (GRDI), v1 (2010 – 2020)
  • Daily and Annual PM2.5, O3, and NO2 Concentrations at ZIP Codes for the Contiguous U.S., v1 (2000 – 2016)
  • Country Trends in Major Air Pollutants v1 (2003 – 2018)
  • Global Monthly and Seasonal Urban and Land Backscatter Time Series v1 (1993 – 2020)
  • Twentieth Century Crop Statistics, v1 (1900 – 2017)
  • Water Security (WSIM-GLDAS) Monthly Grids, v1 (1948 – 2014)

NASA Webinar Features CIESIN Team Presenting Air Quality Products

December 1, 2022

A Webinar hosted by NASA Earthdata on November 30 featured CIESIN deputy director Alex de Sherbinin and research scientist Susana Adamo presenting air quality data sets distributed by the NASA Socioeconomic Data and Applications Center (SEDAC). The Webinar covered global gridded and tabular country and city trend data for particulate matter and other pollutants, and grids focusing on the United States for particulate matter, ozone, and nitrogen-dioxide. The Webinar also demonstrated the use of these data products with a variety of SEDAC data sets—Gridded Population of the World (GPWv4), Social Vulnerability Grids, and the recently released Global Relative Deprivation Index—to study health impacts and environmental justice.

See:
  • NASA Earthdata Webinar: NASA Socioeconomic Data and Applications Center Data Sets for Health and Air Quality Impacts (recording)

Most Nations Will Miss 2050 Climate Targets, Finds Latest Environmental Performance Index

June 1, 2022
Screenshot of 2022 Environmental Performance Index, showing a body of water with birds flying above in the horizon

The majority of countries worldwide will fall short of the net-zero goal to reduce greenhouse gas (GHG) emissions by 2050, according to the 2022 Environmental Performance Index (EPI) produced by researchers at the Yale Center for Environmental Law & Policy (YCELP) and CIESIN. The EPI uses emissions data from the past 10 years as a basis for projecting mid-century levels for 180 countries. For the first time India’s EPI score was the lowest among all countries, reflecting its drastically poor air quality and quickly rising GHG emissions. Intensifying air pollution and increasing GHG emissions also placed China towards the bottom of the 2022 scorecard, at 160. Among rich countries, the US was ranked low at 43; although it has reduced its emissions, its starting rate is so high that it is unlikely to make the 2050 target. Countries beset by conflict or other crises such as Myanmar and Haiti or nations that favored economic growth over environmental concerns—for example, Vietnam, Bangladesh, and Pakistan—also received low rankings.

Denmark was again rated the most sustainable nation, with the United Kingdom and Finland close behind owing to success in cutting GHG emissions. Sweden and Switzerland were among high-scoring countries for air and water quality. Offering insights into the drivers of good environmental performance, CIESIN senior research scientist Alex de Sherbinin, one of the lead authors of the 2022 EPI, explained, “Good governance, policy commitment, and targeted environmental investments separate the nations that are moving toward a sustainable future from those that are not. High-scoring countries have well-thought-through programs to protect public health, conserve natural resources, and mitigate greenhouse gas emissions.”

The 2022 EPI used 40 performance indicators to rank 180 countries on their proximity to international targets for addressing air and water pollution, waste management, and biodiversity and habitat protection, as well as the transition to a clean energy future. Even with continuing lags in GHG emissions reduction worldwide, over the past decade significant progress has been made on critical environmental health issues like sanitation, drinking water, and indoor air pollution. YCELP and CIESIN have collaborated in producing the EPI biennially since 2006.

Adapted from a press release by the Yale Center for Environmental Law & Policy.


Environmental Justice Roundup: SEDAC Data Helps Advance Social Equity

March 13, 2022
Left map: Racial make-up of the Greater Houston Metropolitan Area. Right map: Block group level Flood Vulnerability Index created by SEDAC and IRI.

Source: Understanding Flood Vulnerability: A Case Study of Harris County (StoryMap) 

Climate change disproportionately affects the poor and socially vulnerable. The scientific community is responding in its commitment to data and services development that can advance environmental justice. A recent NASA Earthdata Backgrounder profiles some of the work the NASA Socioeconomic Data and Application Center (SEDAC) is doing in this area.

The backgrounder describes a research project focused on the low-wealth, predominately Black community of the Hampton Roads region of Norfolk, VA, which is experiencing rising sea level rise in part because the land area is sinking. SEDAC population data was paired with satellite data to reveal high population density combined with anomalously high sea surface height in this area, identifying high vulnerability. Integrating different types of data in this way lets planners and policymakers make better-informed mitigation decisions that take into consideration social as well as physical impacts of sea-level rise, better insuring environmental justice for vulnerable communities.

In a second example, in collaboration with the International Research Institute for Climate and Society (IRI), SEDAC helped develop an index that assesses flood vulnerability for Harris County, Texas. Taking a multidisciplinary approach to capturing resilience and susceptibility to flooding, 15 indicators were combined into an aggregate index. The tool can visualize flood vulnerability at the block group level for Harris County and analyze relative flood vulnerability across the region, improving prioritization of flood remediation policies and aid.

CIESIN director Robert Chen, with associate director for Science Applications Alex de Sherbinin and research scientist Susana Adamo, helped organize and co-lead a NASA Equity and Environmental Justice virtual workshop, in their respective SEDAC roles as manager, deputy manager, and project scientist. The workshop report was released in December 2021.

Report of NASA Workshop on Equity and Environmental Justice Now Available

January 30, 2022

SEDAC manager Robert Chen, with deputy manager Alex de Sherbinin and project scientist Susana Adamo, helped organize and co-lead the NASA Equity and Environmental Justice virtual workshop held October 20, 2021. NASA Earth Science Division (ESD) director Karen St. Germain opened the event, which brought together 15 invited experts, including SEDAC User Working Group (UWG) chair Barbara Ryan and several other UWG members, ESD staff, and representatives from social science research organizations who engage with environmental justice (EJ) research and communities. Chen, de Sherbinin, and Adamo co-led several breakout groups, working closely with SEDAC program scientist Nancy Searby and other NASA staff. The workshop report is now available.

In early 2021, a Biden administration executive order on equity directed all federal agencies to incorporate achieving environmental justice in their missions. In June 2021, NASA launched Mission Equity, a comprehensive effort to assess expansion and modification of agency programs, procurements, grants, and policies, and examine potential barriers and challenges for historically underrepresented and underserved communities.

See:
  • Workshop Report
  • NASA Science Equity and Environmental Justice

New Study Addresses Growing Threat of Extreme Heat in Cities Worldwide

October 4, 2021
Global map shows annual municipality-level increases in the rate of urban population exposure to extreme heat for the years from 1983 through 2016.
Tuholske et al., PNAS, 2021

Annual municipality-level increases in the rate of urban population exposure to extreme heat, 1983–2016. 

Rising air temperatures associated with climate change are a threat to cities throughout the world, but especially to the urban poor. The poor generally have fewer adaptive resources and less protective shelter; they have greater health vulnerability to extreme heat, and lower ability to evacuate. These conditions can be exacerbated by the urban heat island effect, where closely spaced structures with lots of pavement and limited green space, common to poorer neighborhoods worldwide, retain heat more readily and for a longer duration. Better understanding of patterns of local exposure to extreme heat is critically needed to design adaptive measures and improve health outcomes. However, until now, global, fine-resolution data on the intersection of extreme heat and population distribution in urban settings have been limited.

A new study published in the prestigious journal, Proceedings of the National Academy of Sciences (PNAS), “Global Urban Population Exposure to Extreme Heat,” is the first to combine temperature, relative humidity, and population data to provide a more detailed and comprehensive view of how extreme heat exposure is likely to impact many more people in cities around the world in the coming decades. Lead author is Earth Institute Fellow Cascade Tuholske, based at CIESIN, with co-authors Kelly Caylor, Chris Funk, Andrew Verdin, Stuart Sweeney, Kathryn Grace, Pete Peterson, and Tom Evans. The team used new, fine-resolution temperature, relative humidity, and population data to assess urban extreme heat exposure in more than thirteen thousand cities, from 1983 to 2016. Using a daily maximum wet bulb globe temperature threshold of 30°C (86°F)—which accounts for a combined impact of both temperature and humidity on human health and wellbeing—global exposure was seen to increase nearly 200% from 1983 to 2016. Total urban warming elevated the annual increase in exposure by approximately 50% compared to urban population growth alone. Exposure increased for nearly half of urban settlements worldwide, which in 2016 comprised 1.7 billion people.

The authors also found that how total urban warming and population growth drove the trajectory of exposures was not evenly distributed, thus reinforcing the importance of crafting adaptation measures that address local needs. Their findings further suggest that previous research has underestimated extreme heat exposure, underscoring the necessity for improved data to support the development of targeted adaptions such as early warning systems to reduce harmful effects, especially on the urban poor. Visualize the Data/Associated Press  

See:
  • “Global Urban Population Exposure to Extreme Heat” (PNAS paper)
  • “Exposure to Deadly Urban Heat Worldwide Has Tripled in Recent Decades, Says Study” (blog)
  • Global High Resolution Daily Extreme Urban Heat Exposure (UHE-Daily) Data Set

Data Set Enables Finer View of U.S. Social Vulnerability to Disasters

August 31, 2021
Overview map of the United States showing Social Vulnerability Index  for  2000, 2010, 2014, 2016, 2018

This summer has seen a spate of extreme climate-related events, from record high temperatures to forest fires, floods, and severe storms. Climate and other natural and manmade hazards do not affect all populations equally. Some sub-populations are particularly vulnerable to their effects owing to factors such as low income, lower levels of education, poor housing, or historical inequalities. Parsing out the fine-grained layers of social conditions across the strata of society—how much money people make, who makes up their households, minority status, ability to understand English, dwelling places, and access to transport—can provide the fundamental elements needed to quantify social vulnerability to hazards in the United States. The Centers for Disease Control (CDC) Social Vulnerability Index (SVI), created by the Geospatial Research, Analysis, and Services Program (GRASP) of the Centers for Disease Control and Prevention (CDC) and the Agency for Toxic Substances and Disease Registry (ATSDR), has long been a key resource for local officials to identify communities that may need support before, during, or after hazardous events or disease outbreaks.

To increase the utility of the SVI data set, the NASA Socioeconomic Data and Applications Center (SEDAC) operated by CIESIN gridded the input data and removed uninhabited areas. The resulting data set, the U.S. Social Vulnerability Index (SVI) Grids, enables calculation of the SVI for user-defined areas, facilitating integration with hazard and other geospatial data. The gridded SVI data set uses the same four themes as the CDC/ATSDR index—Socioeconomic, Household Composition and Disability, Minority Status and Language, and Housing Type and Transportation—to rank communities on vulnerability for the entire United States. The SVI data set is based on inputs at the census-tract level for 15 variables for the years 2000, 2010, 2014, 2016, and 2018, and aligns with the Gridded Population of the World (GPW) data set, SEDAC′s flagship data collection.

A map gallery includes an overall SVI map and four maps visualizing each of the themes. Development of the gridded data set and maps was led by Carolynne Hultquist, post-doctoral research scientist at CIESIN.

See:
  • U.S. Social Vulnerability Index Grids, v1 (2000, 2010, 2014, 2016, 2018)

‘Continuing’ Education at CIESIN, Despite Challenges

May 4, 2021
training workshop in Kinshasa, capital of the Democratic Republic of the Congo (DRC), May 6–9, 2019. The workshop sought to strengthen the methodology for fieldwork and data validation efforts to be implemented in the eastern DRC provinces of Tanganyika and Haut-Lomami.

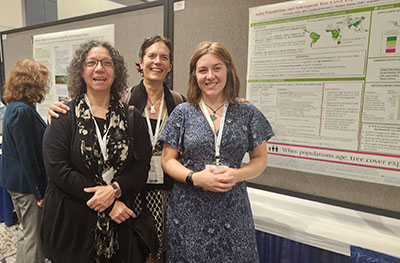
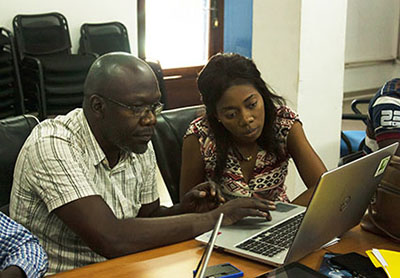
Photo Credit: Anne-Laure White, GRID3

As face-to-face educational activities have been curtailed or even suspended due to the pandemic, CIESIN continues to be active on diverse educational fronts, in online and hybrid venues ranging from academic settings to video series to workshops and Webinars, in addition to ongoing development of online training and curriculum resources. CIESIN staff regularly teach popular courses at graduate and undergraduate level, in a variety of departments, programs, and schools across Columbia University, including Columbia and Barnard Colleges, the Ecology, Evolution, and Environmental Biology (E3B) Department, the Mailman School of Public Health, the School of International and Public Affairs (SIPA), and the School of Professional Studies (SPS).

For the past Fall-Winter term, some CIESIN staff taught classes in “hyflex” mode (designated campus classroom, with online participation by students and faculty as needed)—for example, “Environmental Sustainability Indicators,” by associate director of Science Applications, Alex de Sherbinin, and “Data Analysis & Visualization in Sustainability,” by associate director for Geospatial Applications Greg Yetman. Both classes are in the Sustainability Management Program of the SPS. Supporting Yetman was postdoctoral research scientist Carolynne Hultquist, who taught the same class in the fall. Also this past semester, in online mode, GIS developer Kytt MacManus taught “Spatial Analysis for Sustainable Development,” and senior geographic information specialist Linda Pistolesi taught “GIS for Sustainable Development,” both for Columbia College. For E3B, research scientist Susana Adamo was instructor for “Human Populations and Sustainable Development.”  

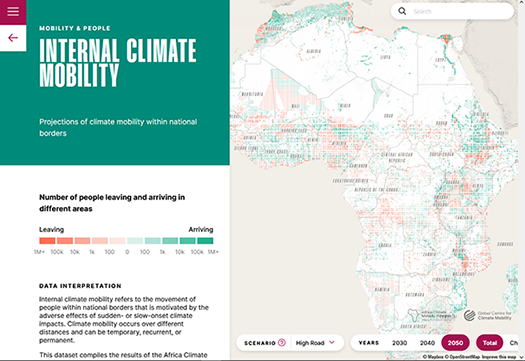
CIESIN is also part of a major new initiative of the new Columbia Climate School. Led by Alex de Sherbinin and Kamal Amakrane, a United Nations diplomat and adjunct professor at SIPA, the Climate Mobility Network is one of nine new “Earth Networks” to facilitate interdisciplinary collaboration across Columbia University in the themes of climate, sustainability and the future of the planet. During its initial three-year phase, the Climate Mobility Network plans to develop a trans-disciplinary course, teaching aids, and tools to help build curriculum and pedagogy on climate mobility. The Network will also work on policy research and modeling in support of operational agencies, building on ongoing work with the World Bank, United Nations Development Programme, the Platform for Disaster Displacement, UNHCR-The UN Refugee Agency, and the International Organization of Migration, as well as the Columbia Global Centers Committee on Forced Migration.

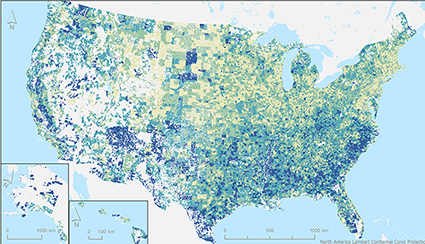
Online educational activities included an educational Webinar series for a non-technical audience, with modules to date on population modelling, mapping settlements, and mapping subnational boundaries, produced by the Georeferenced Infrastructure and Data for Development (GRID3) program. In a separate effort, several online training modules in English and Spanish were co-developed by Susana Adamo, with Professor Landy Sanchez of the Center for Demographic, Urban, and Environmental Studies at El Colegio de Mexico (COLMEX), released by the Population-Environment Research Network (PERN) and supported by the International Union for the Scientific Study of Population (IUSSP) through a grant from the William and Flora Hewlett Foundation. Focused on the fundamentals of spatial data integration and geared towards demographers and other population researchers, the video-based tutorials draw on pre-packaged data and open source geographic information system (GIS) and Web-based tools. This past year, CIESIN senior geographic information specialist Dara Mendeloff participated in Earth Institute Live (EI Live), an online series for K–12 students and educators. Coordinated by the Education and Outreach Office of the Lamont Doherty Earth Observatory (LDEO), live video lessons were led by experts in a broad variety of scientific disciplines across the EI. In one session, Mendeloff gave an introduction to geographic information systems (GIS); in another, she highlighted select data science tools used in climate research. She also took part in a professional development event for K–12 educators, sponsored by the EI, which focused on teaching climate change in the classroom.

See:
  • Education and Resources at CIESIN

Virtual Venues Showcase Diverse Data Developments

April 27, 2021

CIESIN scientists remain active in a number of different scientific communities, despite travel restrictions due to the COVID-19 pandemic. On April 27, at the virtual meeting of the European Geophysical Union, Martin Juckes, co-manager of the Intergovernmental Panel on Climate Change (IPCC) Data Distribution Center (DDC), presented a lightning presentation and poster paper, “IPCC Data Distribution Centre: FAIR Data from Climate Research to Mitigation Policy.” Robert Chen and information scientist Xiaoshi Xing were co-authors. CIESIN is one of four organizations that jointly operate DDC; the other three are based in the UK, Germany, and Spain. The IPCC DDC provides access to key data sets used in IPCC assessments and reports. Also participating was Robert Downs, CIESIN senior digital archivist, who co-authored the presentation, “Towards Developing Community Guidelines for Sharing and Reusing Quality Information of Earth Science Datasets,” given by Carlo Lacagnina, Barcelona Supercomputing Centre.

Senior digital archivist Robert Downs participated virtually in the Research Data Alliance (RDA) 17th Plenary Meeting (RDA P17) April 20–23 and the 16th International Digital Curation Conference (IDCC21) on April 19, both coordinated from Edinburgh, Scotland. During RDA P17, Downs presented the poster, “Peer Review of Open Research Data: The Approach of a Scientific Data Center.” He also chaired the joint session, “Collaborating to Improve Platforms and Share Resources among Open Data Repositories,” where he presented, “Improving Repositories through Collaboration.”  At the IDCC21, Downs gave the presentation, “Documentation to Foster Sharing and Use of Open Earth Science Data: Quality Information,” co-authored with Ge Peng of NASA’s Marshall Space Flight Center, David Moroni of NASA’s Jet Propulsion Laboratory, Hampapuram Ramapriyan of Science Systems and Applications, Inc., and Yaxing Wei of Oak Ridge National Laboratory. 

As part of the International Research Institute for Climate and Society (IRI) seminar on April 20, CIESIN postdoctoral research scientist Carolynne Hultquist gave the presentation, “Bringing Vulnerable Populations into the Flood Risk Equation.” Two graduate student interns also participated: Raychell Velez, who is working toward her MS in geographic information systems (GIS) at Lehman College of the City University of New York; and Colleen Neely, an MPA student in environmental science and policy at Columbia’s School of International and Public Affairs (SIPA). Hultquist gave an overview of relevant data and services from the NASA Socioeconomic Data and Applications Center (SEDAC) and described ongoing efforts to improve vulnerability data for flood risk assessment. Velez presented work supported by SEDAC to develop high resolution data on building exposure to floods using artificial intelligence (AI) approaches. Neely, an Earth Institute intern with Hultquist and IRI scientist Andrew Kruczkiewicz, discussed work on a high resolution flood vulnerability index for Houston, Texas, designed to support more equitable flood mitigation efforts.

See:
  • Research Data Alliance
  • 16th International Digital Curation Conference
  • “Improving Repositories through Collaboration”
  • “Documentation to Foster Sharing and Use of Open Earth Science Data: Quality Information”

New Data Released on Geocoded Hazards, Infant Mortality, and Shared Socioeconomic Pathways

March 22, 2021

The NASA Socioeconomic Data and Applications Center (SEDAC) operated by CIESIN has released several new data sets related to hazards, infant mortality, and future socioeconomic scenarios. The Geocoded Disasters (GDIS) Dataset is a geocoded extension of a selection of natural disasters from the Centre for Research on the Epidemiology of Disaster (CRED) Emergency Events Database (EM-DAT). The data set includes nearly 40,000 locations for almost 10,000 disasters worldwide for the 58-year period spanning 1960–2018. It encompasses all EM-DAT-recorded floods, storms, earthquakes, landslides, droughts, volcanic activity and extreme temperatures, some at administrative level 3 (district/commune/village) but most at 1 (typically state/province/region). GDIS facilitates geospatial analysis of past hazard events.

The Shared Socioeconomic Pathways (SSPs) Literature Database consists of biographic information, abstracts, and analysis of 1,360 articles published 2014–2019 that make substantial use of the SSPs. The database was developed by Carole Green et al. as the basis for a recent article in Nature Climate Change that analyzes use of the Climate Change Scenario Framework and associated scenario data sets in diverse application areas and in assessments of the Intergovernmental Panel on Climate Change (IPCC). The International Committee on New Integrated Climate Change Assessment Scenarios (ICONICS) is planning to extend the literature database. SEDAC User Working Group member Brian O'Neill of the Joint Climate Change Research Institute and CIESIN director Robert Chen are members of ICONICS.

Global Subnational Infant Mortality Rates (IMR), Version 2.01, provides more recent and higher-resolution infant mortality data, including estimates of births and infant deaths. The estimates are for 234 countries and territories, 143 of which include subnational units and are benchmarked to the year 2015 (versus year 2000 for the first version). IMR data are drawn from national offices, Demographic and Health Surveys (DHS), Multiple Indicator Cluster Surveys (MICS), and other sources covering 2006–2014. The birth and infant death data can be aggregated or disaggregated to calculate IMRs at different scales or resolutions. Boundary inputs are derived primarily from the Gridded Population of the World, Version 4 (GPWv4) data collection. National and subnational data are mapped at a spatial resolution of 30 arc-seconds (~1 km at the equator), facilitating integration with demographic, environmental, and other spatial data. Data set development was led by senior geographic information specialist Dara Mendeloff and research scientist Susana Adamo.

The data set, Georeferenced U.S. County-Level Population Projections, Total and by Sex, Race and Age, Based on the SSPs, 2020–2100, contains county-level population projection scenarios of total population, and by age, sex, and race in five-year intervals for all US counties 2020–2100. These data can serve as inputs for addressing questions involving sub-national demographic change in the United States in the near, middle- and long-term. 

See:
  • Geocoded Disasters (GDIS)
  • Shared Socioeconomic Pathways (SSPs) Literature Database
  • Global Subnational Infant Mortality Rates (IMR), Version 2.01
  • Georeferenced U.S. County-Level Population Projections, Total and by Sex, Race and Age, Based on the SSPs, 2020-2100

2020 Human Planet Atlas Showcases Diverse Applications of Global Human Settlement and Population Data

January 22, 2021

The Joint Research Centre (JRC) of the European Commission has released the 2020 edition of the Atlas of the Human Planet, focused on open geoinformation for research, policy, and action, under the auspices of the Human Planet Initiative of the Group on Earth Observations (GEO). This year′s Atlas features more than 30 applications of the georeferenced human settlement and population data in four thematic areas: disaster risk management, urbanization, development, and environment and sustainability. Two of the applications showcased were developed by CIESIN: the Global COVID-19 Viewer operated by the NASA Socioeconomic Data and Applications Center (SEDAC), in “Mapping the COVID-19 Pandemic and Potential Risk Factors,″ and a summary of an update to a 2007 data set available from SEDAC, in “New Estimates of Global Population and Land in the Low Elevation Coastal Zone Using GHSL-based Data Sets.″ The first showcase was prepared by CIESIN director Robert Chen, GIS programmer Kytt MacManus, and associate director for Science Applications Alex de Sherbinin. The second was authored by MacManus, former SEDAC project scientist Deborah Balk of Baruch College, staff associate Hasim Engin, UK demographer Gordon McGranahan, former research staff assistant Rya Inman, and intern Alexandra Hayes.

The JRC organized a virtual launch event January 21 that drew more than 90 participants. The event included 4 short presentations on selected applications, including the Global COVID-19 Viewer example, described by Chen. The Viewer, developed and enhanced in 2020, helps users visualize a range of data on COVID-19 cases and mortality in relationship to spatial data on demographic and environmental factors that may affect exposure and vulnerability, such as age structure, degree of urbanization, air quality, and elevation. Chen and Martino Pesaresi of the JRC are co-leaders of the GEO Human Planet Initiative.

See:
  • Atlas of the Human Planet 2020

Virtual Conferences Expand Opportunities for International Discussion and Outreach

December 8, 2020

Due to the ongoing pandemic, many international conferences have shifted to online, virtual platforms in 2020, opening up opportunities for CIESIN staff to interact remotely with new communities and showcase recent work and new resources. For example, associate director for Science Applications Alex de Sherbinin recently gave a remote keynote address, “Groundswell Model Results for South Asia,” November 25 at the International Conference on Building Resilient and Sustainable Societies, organized by Jamia Millia Islamia University in New Delhi. The address discussed ongoing work with the World Bank to model how climate impacts may induce migration out to 2050. He and research scientist Susana Adamo also participated in the virtual meeting of the Platform for Disaster Displacement’s Data and Knowledge Working Group November 24, where they gave the respective presentations, “Novel and Big Data Approaches to Identifying Disaster Displacement,” and “Migration, the COVID-19 Pandemic, and Climate in Central America’s Northern Triangle.”

During the International CODATA FAIR Convergence Symposium 2020 held virtually November 27–December 4, CIESIN director Robert Chen presented in a panel session, “Synergies between Citizen Science Data and the UN Sustainable Development Goal (SDG) Indicators,” organized by Dilek Fraisl of the International Institute for Applied Systems Analysis (IIASA) in Austria. Chen then led a breakout group within this session. Alex de Sherbinin also contributed to the session, “Citizen Science in Africa for the SDGs,” giving closing remarks. The Symposium was organized by the Committee on Data (CODATA) of the International Science Council and the GO FAIR initiative.

On December 1 Chen gave a short presentation, “Open Data Sharing Across the Disaster Lifecycle," in the community session, "A Call to Action for Resilience: Moving from Research to Practice,” held as part of the World Bank’s 2020 Understanding Risk Forum (UR2020) December 1–3. The session was organized by Charles Huyck of ImageCat, Inc. and Shanna McClain of NASA. Chen highlighted the importance of open data access and reuse throughout the disaster management lifecycle, not just in the immediate aftermath of an extreme event.

See:
  • International FAIR Convergence Symposium 2020
  • World Bank’s 2020 Understanding Risk Forum (UR2020)
  • Platform for Disaster Displacement’s Data and Knowledge Working Group Virtual Meeting

Experts from Colombia and Paraguay Participate in Workshop on Using Gridded Population Data for Sustainable Development

December 2, 2020

Professor Stefan Leyk of the University of Colorado organized and led a virtual workshop November 30, “Gridded Population Data for the Sustainable Development Goals,” for experts from Colombia's National Administrative Department of Statistics (DANE) and Paraguay's General Directorate of Statistics, Surveys, and Censuses (DGEEC). The workshop provided an overview of the development and sources of gridded population data, hands-on technical training in working with selected data, and a forum for obtaining feedback on user needs. CIESIN Director Robert Chen gave introductory remarks during the opening session, and in the final session research scientist Susana Adamo provided an update in Spanish on progress and plans for the fifth version of the Gridded Population of the World (GPW) data set. Associate director for Science Applications Alex de Sherbinin, associate director for Geospatial Applications Greg Yetman, and research staff assistant Juan Martinez also attended.

The workshop was organized by Leyk and Maryam Rabiee of the Thematic Research Network on Data and Statistics (TReNDS) of the United Nations Sustainable Development Solutions Network (SDSN), under the auspices of the POPGRID Data Collaborative. Funding for the workshop was provided by Deutsche Gesellschaft für Internationale Zusammenarbeit (GIZ) GmbH. POPGRID is an initiative launched by CIESIN in 2017 to bring together both developers and users of global georeferenced population data in support of development applications. POPGRID activities and resources are supported in part by the Bill & Melinda Gates Foundation and the NASA Socioeconomic Data and Applications Center (SEDAC). Leyk is also a member of SEDAC′s User Working Group.

Collaboration with Lehman College Launched to Develop Hazards Data

November 12, 2020

CIESIN has developed a collaboration with the Department of Earth, Environmental, and Geospatial Sciences at Lehman College of the City University of New York to develop and enhance hazards data, working initially with five Lehman graduate and undergraduate students. Supervised by CIESIN alumnus Yuri Gorokhovich, associate professor in the Department, the students are Christopher Aime, Diana Calderón, Nira Rahman, and Raychell Velez from Lehman's Master′s program in Geographic Information Science; and Hadja Doumbouya, a senior majoring in environmental sciences. CIESIN associate director for Geospatial Applications Greg Yetman is assisting the students in using machine learning methods to develop improved data on the exposure and vulnerability of buildings and other infrastructure to hazards, extending recent work for the State of New York supported by the New York State Energy Research and Development Authority (NYSERDA). Carolynne Hultquist, CIESIN postdoctoral research scientist, and Andrew Kruczkiewicz, senior staff associate at the International Research Institute for Climate and Society (IRI), are also working with the students to apply the data to flash flood hazard assessment.

The collaboration is supported by the NASA Socioeconomic Data and Applications Center (SEDAC) as part of SEDAC's efforts to achieve small business purchasing goals established by NASA, which include collaboration with Minority Serving Institutions (MSIs) and Historically Black Colleges and Universities (HBCUs). Outputs of the collaboration will be made available via SEDAC after appropriate review. Based in the Bronx, Lehman is one of the only MSIs (or HBCU′s) in the US to offer a master of science degree in geographic information science.

1 of 5
Prev | Next
 

Home | Data | Data Uses | Data Citations | Maps | Map Services

News | Tools | Guides | Publications | Blog Posts

About | Help | Privacy | User Registration

Copyright © 1997–2025. The Trustees of Columbia University in the City of New York.

WDS ICSU