NASA Website Socioeconomic Data and Applications Center (sedac)
A Data Center in NASA's Earth Observing System Data and Information System (EOSDIS) — Hosted by CIESIN at Columbia University
Data
  • Data Sets
  • Maps
  • Web Pages
  • home
  • Data
    • · Data Sets
    • · Data Collections
    • · Featured Data Uses
    • · Data Citations
    • · Citations Database
    • · Data Submission
  • Maps
    • · Map Gallery
    • · Map Viewer
    • · Map Services
    • · Mapping Tools
  • Themes
    • · Agriculture
    • · Climate
    • · Conservation
    • · Governance
    • · Hazards
    • · Health
    • · Infrastructure
    • · Land Use
    • · Marine and Coastal
    • · Population
    • · Poverty
    • · Remote Sensing
    • · Sustainability
    • · Urban
    • · Water
  • Resources
    • · Guides
    • · Multimedia
    • · Networks
    • · News
    • · Publications
    • · Related Sites
    • · Remote Sensing
    • · Tools
  • Social Media
    • · Twitter
    • · FaceBook
    • · YouTube
    • · Flickr
    • · Blog Posts
    • · Communities
  • About
    • · About SEDAC
    • · User Working Group
    • · Privacy
    • · User Registration
  • Help
 

Urbanization and Human Settlements

Follow Us: Twitter Follow Us on Facebook YouTube Flickr   |   Share: Twitter Facebook
  • Theme Home
  • Data Sets
  • Map Gallery
  • Map Services
  • Featured Data Uses
  • Resources
    • Guides
    • Multimedia
    • Networks
    • Publications
    • Related Sites

Spatial disparities within Urban Settlements

The World Development Report 2009 – March 10, 2009
Map of Spatial disparities within Urban Settlements

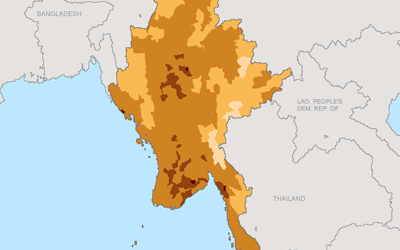
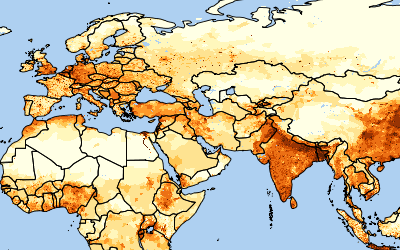
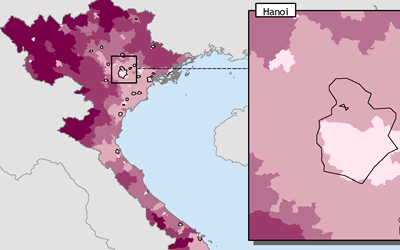
A typically higher standard of living in urban areas compared to rural ones does not rule out striking disparities within cities. SEDAC data from its Global Poverty Mapping Project is used as the basis for this  map. Map 1.2, illustration for Chapter 1--Density, The World Development Report Online 2009.

Earthquake Rocks China

WSJ Online – May 13, 2008
Earthquake Rocks China

Map of China illustrates an article comparing the location of the Sichuan province earthquakes with population centers in China.

Disaster Awaits Cities in Earthquake Zones

The New York Times – February 24, 2010
Disaster Awaits Cities in Earthquake Zones

Data and maps compiled by SEDAC and the Center for Hazards and Risk Research are featured in a front-page news article in the New York Times (print version February 25) assessing the vulnerability of buildings in earthquake zones. “Where Shoddy Construction Could Mean Death” shows a map (top) that depicts the predicted number of deaths in Instanbul from a magnitude 7.5 earthquake, depending on the type of construction of the building. The second map (bottom) ranks the vulnerability of other urban areas in earthquake zones with more than one million people.

Caught in the Danger Zone

The Wall Street Journal – January 13, 2010
CIESIN supplied population density data for a map of the Haiti earthquake.

SEDAC population density data was used in a map of the Haiti earthquake.

Changing Global Patterns of Urban Exposure to Flood and Drought Hazards

Global Environmental Change – January 15, 2016
Changing Global Patterns of Urban Exposure to Flood and Drought Hazards

Combining SEDAC’s Low Elevation Coastal Zone (LECZ) data and Natural Disaster Hotspots flood frequency maps with land cover imagery derived from NASA’s MODIS instrument, the researchers who developed SEDAC’s Global Grid of Probabilities of Urban Expansion data set ask how the global and regional patterns of urban growth in the near future will affect urban susceptibility to floods and droughts.  What they found is that the extent of urban areas exposed to floods and drought will generally double by 2030, even without factoring in the potential impacts of climate change.

People Reported Missing via IReport

CNN – February 23, 2010
People Reported Missing via IReport

This interactive map shows the population missing as a result of the Haiti earthquake on January 28, 2010. Thousands of personal reports of loved ones missing were provided to Ireport, and this information was combined with SEDAC population data to create the map.

NASA Data Helps Pinpoint Impacted Populations in Disaster Aftermath

Space & Earth science/Earth Sciences – June 13, 2008
NASA Data Helps Pinpoint Impacted Populations in Disaster Aftermath

A map of Burma, based on the SEDAC Gridded Population of the World (GPW) data product, reveals that coastal areas hit hardest by the cyclone in May 2008 were highly populated. (Areas in progressively darker shades of brown represent increased population.)

Beyond Seven Billion

Los Angeles Times – July 23, 2012
A five-part article examines the implications of world population growth beyond seven billion; SEDAC's Human Footprint data shows where Earth been most impacted.Beyond 7 Billion feature image showing chinese people crowded on an escalator

A five-part article examines the implications of world population growth beyond seven billion; SEDAC's Human Footprint data shows where Earth been most impacted.

Earthquakes and Aftershocks

CNN – February 23, 2010
Earthquakes and Aftershocks

An interactive map shows impacts from the recent Haiti earthquake.

Taliban Wages War on Police in Its New Front in Pakistan

The Wall Street Journal – May 28, 2008
Taliban Wages War on Police in Its New Front in Pakistan

Map of Pakistan illustrating areas of escalating violence in the Punjab, the country’s most populous province.

Scorecard on the Environment

NASA Earth Data Web Site – December 1, 2007
Scorecard on the Environment

Sensing Our Planet: NASA Earth Science Research Features 2008 features an article on how SEDAC data was used for the 2008 Environmental Performance Index and other environmental assessments; CIESIN’s Marc Levy is interviewed.

Geo Quiz

PRI’s The World – June 10, 2009
Geo Quiz

The report on linkages between climate and migration, In Search of Shelter, is featured in a daily geography quiz of the public radio program, PRI’s The World.

Gridded Population of the World Version 3

National Geographic – May 19, 2011
A map of the Gridded Population of the World Version 3

A map using SEDAC′s Gridded Population of the World data set to illustrate a discussion of population density and population growth, page 50 of the National Geographic Visual Atlas of the World (2009).

Turning Schools from Death Traps into Havens

Science Times section of The New York Times – May 27, 2008
Turning Schools from Death Traps into Havens

Map of school-age children in earthquake zones illustrates an accompanying article: following the recent earthquakes in China, experts assess school safety and the vulnerability of children to earthquakes.

Home | Data | Data Uses | Data Citations | Maps | Map Services

News | Tools | Guides | Publications | Blog Posts

About | Help | Privacy | User Registration

Copyright © 1997–2023. The Trustees of Columbia University in the City of New York.

WDS ICSU