|
CIESIN has released a new Web site and mapping tool designed to help users learn about the growing number of gridded population data sets, and make decisions about which data sets may be the most useful for their needs. The POPGRID web site and viewer were developed under the auspices of the POPGRID Data Collective, an initiative launched by CIESIN in 2017 with support from the Earth Institute, the Bill & Melinda Gates Foundation (BMGF), and the NASA Socioeconomic Data and Applications Center (SEDAC). The POPGRID web site provides users with detailed background information and documentation, as well as direct links to the data and data sources.
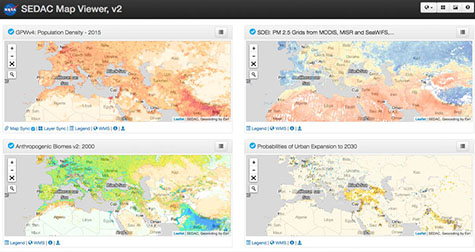
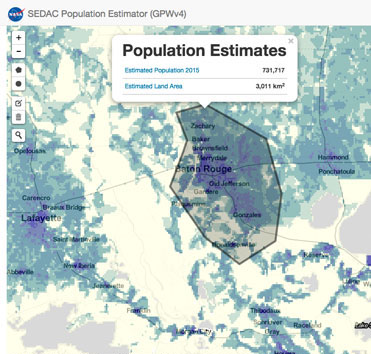
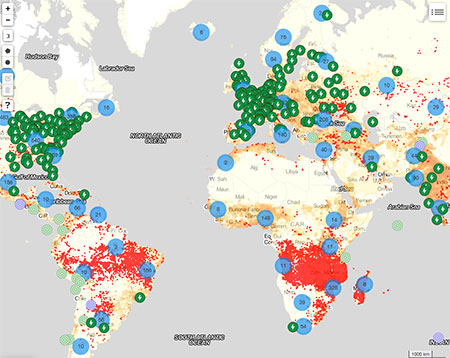
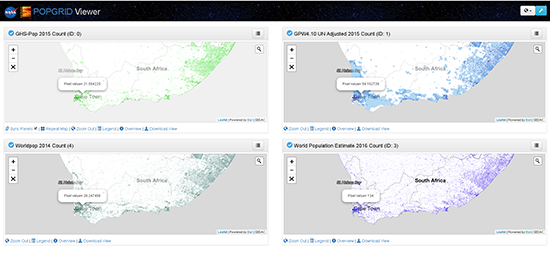
The POPGRID Viewer incorporates a four-panel display of population count data available from six different data sets: the Gridded Population of the World (GPWv4.10) 2015 count developed by SEDAC; Landscan 2015 developed by Oak Ridge National Laboratory; WorldPop Estimates 2014 from the WorldPop project; Global Human Settlement Population Grid 2015 (GHS-POP) developed by the European Commission’s Joint Research Centre and CIESIN; the Esri World Population Estimate 2016 (WPE); and the High Resolution Settlement Layer (HRSL) developed by the Facebook Connectivity Lab and CIESIN. Users may zoom in on a location of interest anywhere in the world and see the population estimates for four of the six data sets at the same time. A single-panel mode lets users compare national-level metadata across the data sets and draw a polygon or rectangle to obtain an intercomparison table and chart containing customized estimates from all six population data sets (when available). Users of Geographic Information Systems (GIS) may also supply a shapefile to obtain the population estimates for a specific region with a complex shape.
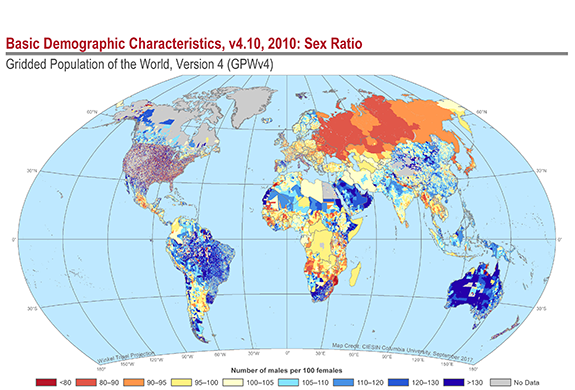
Direct comparison of these data sets is important because they are based on different data sources and methodologies that may affect their usability for different purposes. For example, the GPWv4.10 data are based solely on Census data for subnational administrative units, assuming a uniform distribution of population even in large rural districts. Other data sets utilize high-resolution remote sensing data combined with machine-learning algorithms to allocate population to built-up areas. In addition, some data sets use additional inputs such as distance from roads, slope, and other factors to model population distribution at high resolution. The data sets also differ in the time periods covered, the quality and consistency of inputs in different regions, and the demographic characteristics estimated (e.g., age groups). These differences may make the data more useful for some applications, such as assessing potential exposure to extreme events or climate change, but less useful for others, such as estimating the number of vaccines needed in an area of interest.
The POPGRID Data Collective was established to bring together and expand the international community of data providers, users, and sponsors concerned with georeferenced data on population, human settlements, and infrastructure. POPGRID seeks to promote cooperation and reduce overlap in producing data, and to encourage trans-disciplinary use and development of data, among other related goals. CIESIN led the initial phase of POPGRID, and is working with the Global Partnership for Sustainable Development Data (GPSDD) and the Thematic Research Network on Data and Statistics (TReNDS) of the United Nations Sustainable Development Solutions Network (UNSDSN) to initiate a second phase of POPGRID with support from BMGF. POPGRID is also contributing to the Group on Earth Observations (GEO) Human Planet Initiative, which aims to improve the quality and accessibility of data needed for assessing humanity’s impact on the planet, access to resources, and exposure to risk.