Data Sets (19)
|
1 of 1
Prev
|
Next
|
Global Pesticide Grids (PEST-CHEMGRIDS), v1.01 (2015, 2020, 2025)Global Agricultural Inputs, v1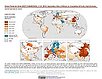
To provide a global gridded data set of commonly-used agricultural pesticides crucial to assess human and ecosystem exposure to potential toxicants for environmental modeling, assessment of agricultural chemical contamination and risk analysis, and other related research at global, regional, national, and local levels. |
Global Development Potential Indices, v1 (2016)Land Use and Land Cover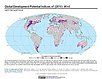
To provide spatially-explicit data that relatively rank global land suitability referred to as Development Potential Indices (DPIs) for 13 sectors related to renewable energy, fossil fuels, mining and agriculture as an aid to conservation priority setting. |
|
Environmental Performance Index, 2020 Release (
|
Development Threat Index, v1 (2015)Land Use and Land Cover (LULC)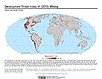
To provide a future development threat map based on combining these resources: agricultural expansion, urban expansion, conventional oil and gas, unconventional oil and gas, coal, mining, biofuels, solar, and wind. |
|
Environmental Performance Index, 2018 Release (
|
||
Global Urban Heat Island (UHI) Data Set, v1 (2013)Satellite-Derived Environmental Indicators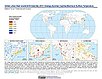
To provide a global data set of average summer daytime maximum/nighttime minimum land surface temperatures (LSTs) for urban extents, as well as the LST difference between the urban area and the buffer. |
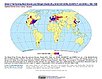
Global Summer Land Surface Temperature (LST) Grids, v1 (2013)Satellite-Derived Environmental Indicators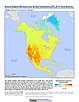
To provide raster representations of global summer daytime maximum and nighttime minimum surface temperature for studies related to human health and climate change. |
|
Environmental Performance Index, 2016 Release (
|
ATSDR Hazardous Waste Site Polygon Data with CIESIN Modifications, v2 (2010)Superfund Site FootprintsTo provide an easily accessible, corrected data set of polygons for hazardous waste sites in the United States which can be used to identify nearby populations and assess their potential risk. |
|
Environmental Performance Index, 2014 Release (
|
U.S. EPA National Priorities List Sites with CIESIN Modifications, v2 (2014)Superfund Site Footprints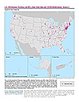
To provide an easily accessible, corrected EPA data set of the geo-referenced locations displayed as points for all the National Priorities List (NPL) Superfund sites in the United States, Puerto Rico, and other territories. |
|
ATSDR Hazardous Waste Site Polygon Data, v2 (2010)Superfund Site FootprintsTo provide the ATSDR polygon data set of hazardous waste sites in the United States, Puerto Rico, and other territories which can be used to identify nearby populations and assess their potential risk. |
Environmental Performance Index, 2010 Release (
|
|
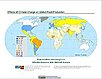
Change in Chlorophyll-a Concentration, v1 (
|
||
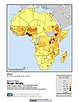
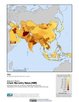
Global Subnational Prevalence of Child Malnutrition, v1 (
|
||
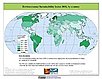
Environmental Sustainability Index, 2005 Release (
|
|
1 of 1
Prev
|
Next
|