Data Sets » Format: rasterRemove Facet
1 of 9
Prev | Next

Daily 8-Hour Maximum and Annual O3 Concentrations for the Contiguous United States, 1-km Grids, v1.10 (2000 – 2016)

Air Quality Data for Health-Related Applications

To provide daily 8-hour maximum and annual ground-level Ozone (O3) concentration data in the U.S. at a resolution of 1-km (about 30 arc-seconds) for public health research to respectively estimate short- and long-term effects on human health, and for other related research.

Daily and Annual PM2.5 Concentrations for the Contiguous United States, 1-km Grids, v1.10 (2000 – 2016)

Air Quality Data for Health-Related Applications

To provide daily and annual PM2.5 concentration data in the U.S. at a resolution of 1-km (about 30 arc-seconds) for public health research to respectively estimate short- and long-term effects on human health, and for other related research.

Daily and Annual NO2 Concentrations for the Contiguous United States, 1-km Grids, v1.10 (2000 – 2016)

Air Quality Data for Health-Related Applications

To provide daily and annual Nitrogen Dioxide (NO2) concentration data in the U.S. at a resolution of 1-km (about 30 arc-seconds) for public health research to respectively estimate short- and long-term effects on human health, and for other related research.

U.S. Climate Risk Projections by County, v1 (2040 – 2049)

Climate Risk and Vulnerability

To provide a U.S. county-level multi-hazard climate risk projection for 2040-2049 for climate, socioeconomic, environmental, and other related research.

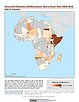
Groundswell Africa Spatial Population and Migration Projections at One-Eighth Degree According to SSPs and RCPs, v1 (2010 – 2050)

Climate Migration

To provide a data set that allows users to understand how climate change impacts on water availability, crop productivity, and pasturelands (where no cropping occurs), coupled with sea-level rise, storm surge and flooding, may affect the future population distribution and climate-related internal migration in West Africa and the Lake Victoria Basin.

Annual Global High-Resolution Extreme Heat Estimates (GEHE), v1 (1983 – 2016)

Satellite-Derived Environmental Indicators

To provide a high-resolution, longitudinal global data set of annual extreme humid-heat.

Yale Center for Earth Observation (YCEO) Surface Urban Heat Islands, v4 (2003 – 2018)

Satellite-Derived Environmental Indicators

To provide global estimates of the surface urban heat island intensity from monthly, seasonal, to annual scales for over 10,000 urban clusters developed using a simplified urban-extent algorithm.

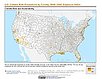
U.S. Social Vulnerability Index Grids, v1.01 (2000, 2010, 2014, 2016, 2018, 2020)

U.S. Census Grids

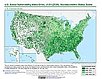
To provide a 1 km grid of the CDC Social Vulnerability Index (SVI) aligned with CIESIN's Gridded Population of the World, Version 4, Revision 11 (GPWv4.11) with a mask for water and no population.

Global (GL) Annual PM2.5 Grids from MODIS, MISR and SeaWiFS Aerosol Optical Depth (AOD), v4.03 (1998 – 2019)

Satellite-Derived Environmental Indicators

To provide an annual global surface of concentrations (micrograms per cubic meter) of all composition ground-level fine particulate matter of 2.5 micrometers or smaller (PM2.5) for large-scale health and environmental research.

Water Security (WSIM-GLDAS) Monthly Grids, v1 (1948 – 2014)

Water Resources

To provide data characterizing 67 years (1948-2014) of anomalous freshwater surpluses, deficits, and the parameters determining them, across the global terrestrial surface.

Daily and Annual NO2 Concentrations for the Contiguous United States, 1-km Grids, v1 (2000 – 2016)

Air Quality Data for Health-Related Applications

To provide daily and annual Nitrogen Dioxide (NO2) concentration data in the U.S. at a resolution of 1 km (about 30 arc-seconds) for public health research to respectively estimate short- and long-term effects on human health, and for other related research.

Global Monthly and Seasonal Urban and Land Backscatter Time Series, v1 (1993 – 2020)

Urban Spatial Data

To provide a 28-year time series of microwave backscatter to support analysis of patterns and trends in growth of global urban building infrastructure.

Global Gridded Relative Deprivation Index (GRDI), v1 (2010 – 2020)

Poverty Mapping

To provide a global gridded relative deprivation index characterizing the levels of multidimensional deprivation in each pixel at ~1 km resolution.

Geocoded Disasters (GDIS) Dataset, v1 (1960 – 2018)

Natural Disasters

To provide the subnational location for different types of natural disasters recorded in EM-DAT between 1960-2018.

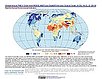
Population (POP), Built-Up Estimates (BUILT), and Degree of Urbanization Settlement Model Grid (SMOD), v1 (1975, 1990, 2000, 2014, 2015)

Global Human Settlement Layer (GHSL)

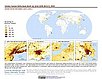
To provide global data on human population, built up area, and degree of urbanization for the years 1975, 1990, 2000, and 2014/2015 in the World Geodetic System 1984 (WGS84) geographic coordinate system.

Global One-Eighth Degree Urban Land Extent Projection and Base Year Grids by SSP Scenarios, v1 (2000 – 2100)

Shared Socioeconomic Pathways (SSPs)

To provide global SSP-consistent spatial urban land projections and base year grids based on the Shared Socioeconomic Pathways (SSPs) data at a resolution of one-eighth degree (7.5 arc-minutes) for climate, socioeconomic, environmental, and other related research.

Global 1-km Downscaled Urban Land Extent Projection and Base Year Grids by SSP Scenarios, v1 (2000 – 2100)

Shared Socioeconomic Pathways (SSPs)

To provide global SSP-consistent spatial urban land projections and base year grids based on the Shared Socioeconomic Pathways (SSPs) data at a resolution of 1-km (about 30 arc-seconds) for climate, socioeconomic, environmental, and other related research.

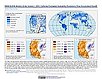
Global Subnational Infant Mortality Rates, v2.01 (2015)

Poverty Mapping

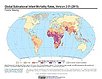
To provide a global subnational map of infant mortality rate estimates for the year 2015, to be used by a wide user community in interdisciplinary studies of health, poverty, and the environment.

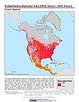
Urban-Rural Population and Land Area Estimates, v3 (1990, 2000, 2015)

Low Elevation Coastal Zone (LECZ)

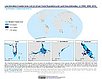
To provide estimates of urban and rural populations and land areas for the years 1990, 2000, 2015 for 234 countries and statistical areas with contiguous coastal elevations of less than or equal to 5m above sea level, 5-10m above sea level, and national totals using multiple updated data sources for comparative analysis.

Daily and Annual PM2.5 Concentrations for the Contiguous United States, 1-km Grids, v1 (2000 – 2016)

Air Quality Data for Health-Related Applications

To provide daily and annual PM2.5 concentration data in the U.S. at a resolution of 1 km (about 30 arc-seconds) for public health research to respectively estimate short- and long-term effects on human health, and for other related research.

Data Sets » Format: rasterRemove Facet
1 of 9
Prev | Next